Chart of the day: USD/ZAR
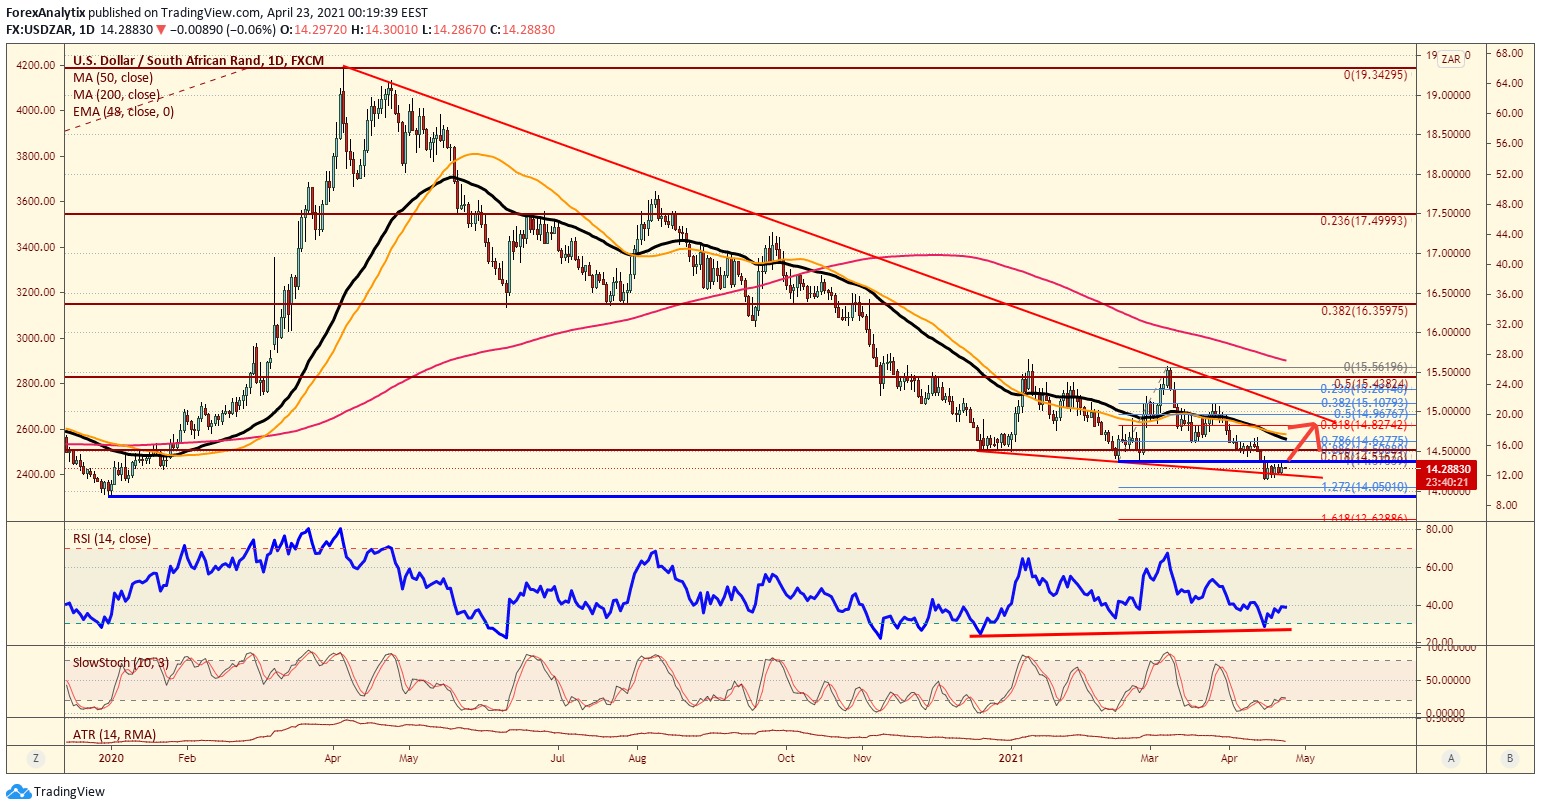
|Many US Dollar pairs have similar setups, but the USD/ZAR is in a descending wedge which may be suggesting a bullish reversal soon. A break of the 14.4000 level could mean a move back to the 15.0000 level which is the long term descending trend line. we should also note, despite the rally to all time highs in US equities, the USDZAR has not broken the lows from the end of 2019, so if the pair does not break the 13.9300 level we could be creating a higher low longer term.
Information on these pages contains forward-looking statements that involve risks and uncertainties. Markets and instruments profiled on this page are for informational purposes only and should not in any way come across as a recommendation to buy or sell in these assets. You should do your own thorough research before making any investment decisions. FXStreet does not in any way guarantee that this information is free from mistakes, errors, or material misstatements. It also does not guarantee that this information is of a timely nature. Investing in Open Markets involves a great deal of risk, including the loss of all or a portion of your investment, as well as emotional distress. All risks, losses and costs associated with investing, including total loss of principal, are your responsibility. The views and opinions expressed in this article are those of the authors and do not necessarily reflect the official policy or position of FXStreet nor its advertisers.