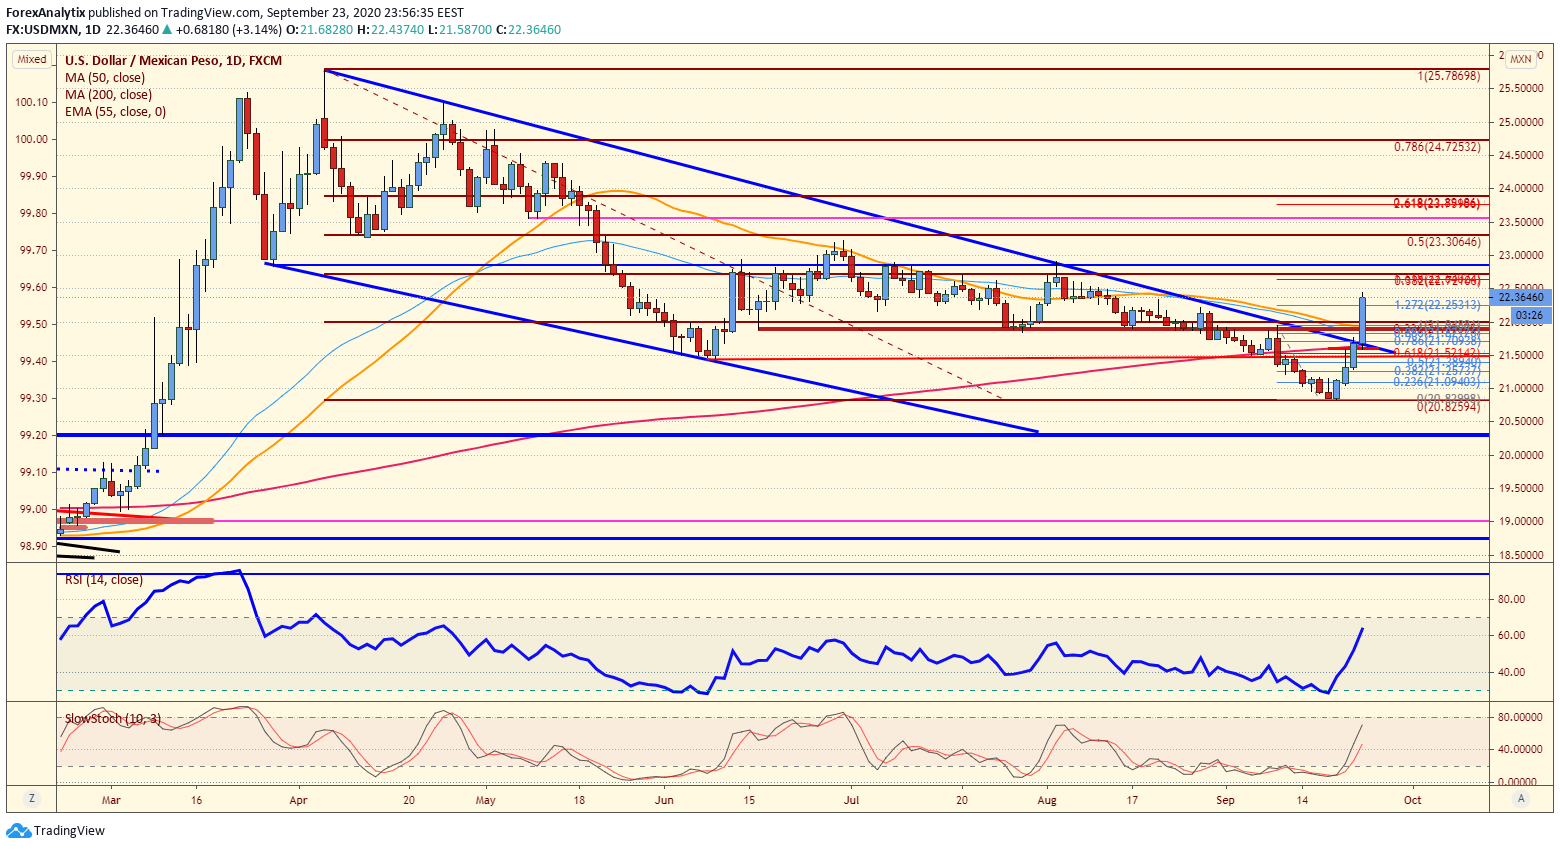
Chart of the day: USD/MXN
|Not only did the USD/MXN break the 200dma, but we broke the channel resistance which has kept the pair under pressure since the highs in March and April. We have also pushed past the 50dma as well. Dip buyers will be looking for moves back to the 22.0000 level, but in my experience moves like this could be very one sided. Strong enough not to let shorts out (at a good price) while at the same time not dipping far enough to let longs in (at a good price). RSI is pointing higher, strongly.
Information on these pages contains forward-looking statements that involve risks and uncertainties. Markets and instruments profiled on this page are for informational purposes only and should not in any way come across as a recommendation to buy or sell in these assets. You should do your own thorough research before making any investment decisions. FXStreet does not in any way guarantee that this information is free from mistakes, errors, or material misstatements. It also does not guarantee that this information is of a timely nature. Investing in Open Markets involves a great deal of risk, including the loss of all or a portion of your investment, as well as emotional distress. All risks, losses and costs associated with investing, including total loss of principal, are your responsibility. The views and opinions expressed in this article are those of the authors and do not necessarily reflect the official policy or position of FXStreet nor its advertisers.