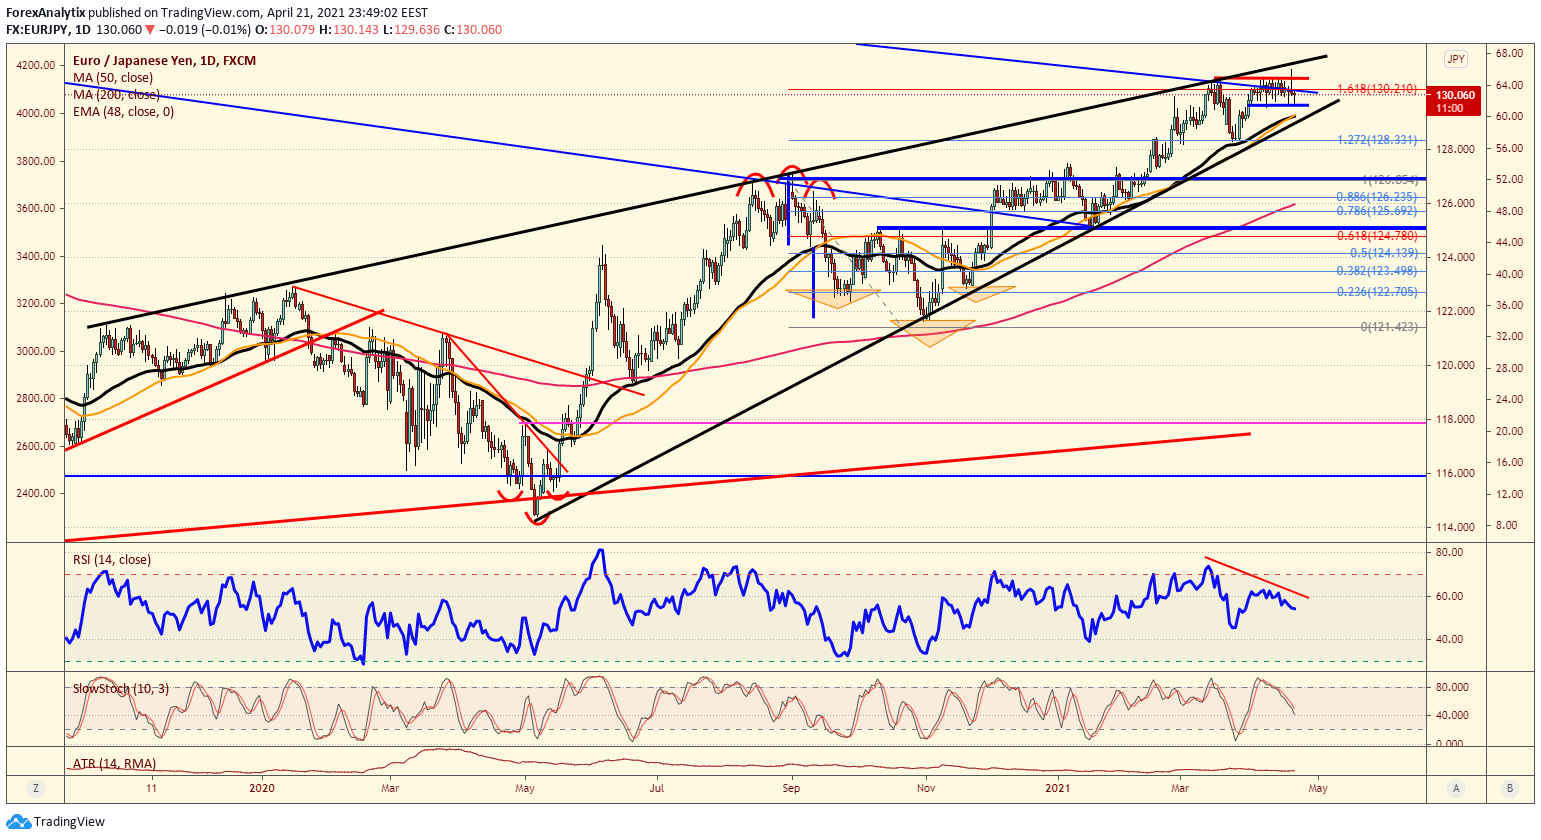
Chart of the day: EUR/JPY
|The EUR/JPY has struggled to make much gains above the 130.00 level the last couple weeks despite “risk assets” like the US equity markets surging to all time highs. If you are bullish, take note that:
- We have been in an ascending wedge since mid 2019, and these are eventual reversal patterns by nature which should be noted
- The daily RSI is divergent.
- The false breakout above the 130.65 level two days ago may lead to a move below the 129.50 support.
- A break of the 129.00 level (trend line) would be a bearish reversal signaling the wedge breakdown.
- A 13yr trend line (from 2008) comes in just above the 130.00 level, so a turn lower in the coming weeks would be a major rejection for the pair in the event we see lower prices
Information on these pages contains forward-looking statements that involve risks and uncertainties. Markets and instruments profiled on this page are for informational purposes only and should not in any way come across as a recommendation to buy or sell in these assets. You should do your own thorough research before making any investment decisions. FXStreet does not in any way guarantee that this information is free from mistakes, errors, or material misstatements. It also does not guarantee that this information is of a timely nature. Investing in Open Markets involves a great deal of risk, including the loss of all or a portion of your investment, as well as emotional distress. All risks, losses and costs associated with investing, including total loss of principal, are your responsibility. The views and opinions expressed in this article are those of the authors and do not necessarily reflect the official policy or position of FXStreet nor its advertisers.