AUD/USD: Defying the death cross and rising above 0.7800 on risk-on
|- The AUD/USD is taking advantage of the positive atmosphere and rising to the highest levels in nearly a month.
- The "death cross" pattern is a bearish technical sign, but other indicators point higher.
The AUD/USD is trading just above A$0.7800, the highest since March 15th. The better mood in the markets is boosting the Australian Dollar, a risk currency. Australia's No. 1 trade partner, China, posted its trade balance figures that show a rise in imports. Some of these imports are Australian commodities.
Also, the increase in Chinese imports from the US helps to sooth trade tensions and the atmosphere in markets. The A$ rises when stocks rise.
Another trade-related factor is the report that US President Donald Trump now seeks to rejoin the Trans-Pacific Partnership (TPP). The deal, which currently includes Australia and ten other Pacific Rim countries was abandoned by the Administration early in 2017. A US comeback into the pact would also help the Australian economy.
The last positive factor is a de-escalation around Syria. Trump hinted that a strike is not imminent and separate reports suggest a conversation between the US and Russia over a potential airstrike.
In Australia, RBA Governor Phillip Lowe indicated that interest rates would likely remain unchanged during this year. This may weigh on the Aussie later on as other central banks are enacting a tightening policy. In the US, the FOMC Meeting Minutes released this week show growing confidence about growth and inflation. The odds for a rate hike in June have risen.
All in all, the AUD/USD enjoys positive momentum.
AUD/USD Technical Analysis
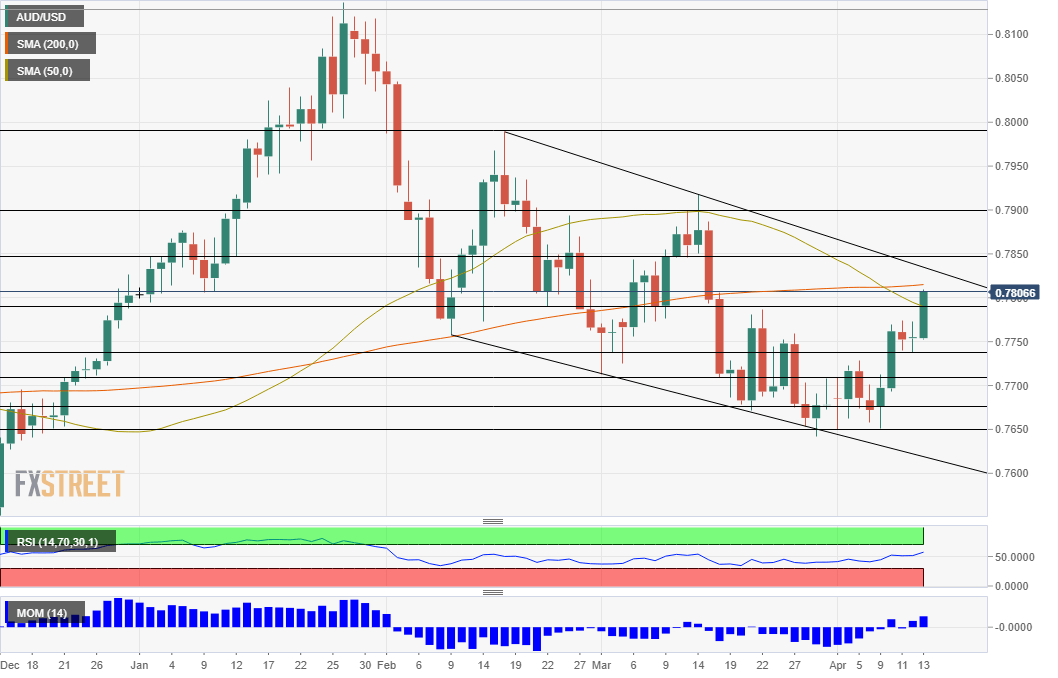
The AUD/USD is moving higher and so are the RSI and Momentum. The pair has crossed the 50-day Simple Moving Average and is currently capped by the 200-day SMA that comes out around A$0.7815.
There is one bearish sign that should be noted: the 50-day SMA recently crossed the 200-day SMA to the downside. This is dubbed the "death cross." Nevertheless, this pattern does not always prove to be viable. More importantly, the AUD/USD is capped by downtrend resistance in the channel.
Resistance awaits at 0.7815, the 200-day SMA and then 0.7850 that separated ranges in March. Further above, the round number of 0.7900 capped the pair earlier in the year.
Looking down, 0.7740 served as support in mid-April after working as resistance earlier in the month. Below, 0.7710 was a line of resistance in late March. The cycle low of 0.7650 awaits below.
More: AUDUSD: Testing resistance at 0.7810
Information on these pages contains forward-looking statements that involve risks and uncertainties. Markets and instruments profiled on this page are for informational purposes only and should not in any way come across as a recommendation to buy or sell in these assets. You should do your own thorough research before making any investment decisions. FXStreet does not in any way guarantee that this information is free from mistakes, errors, or material misstatements. It also does not guarantee that this information is of a timely nature. Investing in Open Markets involves a great deal of risk, including the loss of all or a portion of your investment, as well as emotional distress. All risks, losses and costs associated with investing, including total loss of principal, are your responsibility. The views and opinions expressed in this article are those of the authors and do not necessarily reflect the official policy or position of FXStreet nor its advertisers.