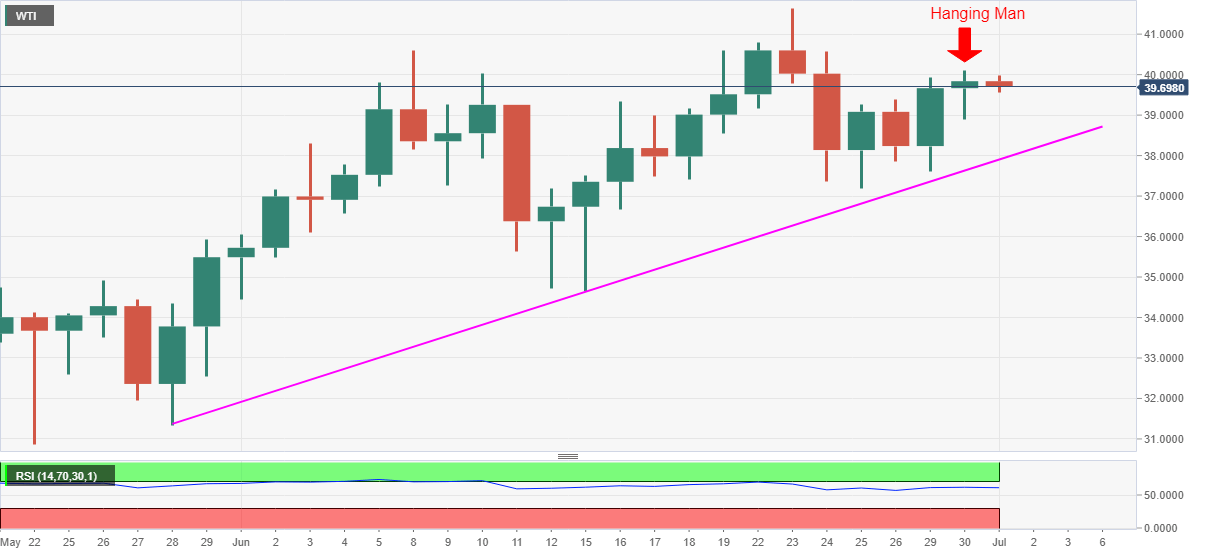
- WTI eases from one week high after flashing a bearish candlestick the previous day.
- An ascending trend line from May 28 appears on the sellers’ radar.
- June month’s top adds to the upside barrier beyond $40.10.
WTI steps back from weekly highs to $39.69 amid the initial Tokyo session trading on Wednesday. The black gold’s recent weakness justifies Tuesday’s bearish candlestick formation on the daily chart.
Hence, sellers are currently targeting a re-test to the five-week-old support line, at $37.90, during the further declines. However, a $39.00 round-figure is expected to offer immediate rest to the energy benchmark.
If at all the bears dominate past-$37.90, the mid-June low near $34.70 and May 28 bottom surrounding $31.30 could return to the charts.
On the flip side, a clear break above the previous day’s high near $40.10 will defy the candlestick formation and trigger the commodity’s recovery moves towards June 08 top near $40.60 ahead of challenging the last month’s peak close to $41.65/70.
Other than the technical details, oil traders will also keep eyes on the weekly readings of the US Crude Oil Stocks Change, expected -0.95M versus 1.442M prior, published by the Energy Information Administration (EIA).
WTI daily chart
Trend: Pullback expected
Information on these pages contains forward-looking statements that involve risks and uncertainties. Markets and instruments profiled on this page are for informational purposes only and should not in any way come across as a recommendation to buy or sell in these assets. You should do your own thorough research before making any investment decisions. FXStreet does not in any way guarantee that this information is free from mistakes, errors, or material misstatements. It also does not guarantee that this information is of a timely nature. Investing in Open Markets involves a great deal of risk, including the loss of all or a portion of your investment, as well as emotional distress. All risks, losses and costs associated with investing, including total loss of principal, are your responsibility. The views and opinions expressed in this article are those of the authors and do not necessarily reflect the official policy or position of FXStreet nor its advertisers. The author will not be held responsible for information that is found at the end of links posted on this page.
If not otherwise explicitly mentioned in the body of the article, at the time of writing, the author has no position in any stock mentioned in this article and no business relationship with any company mentioned. The author has not received compensation for writing this article, other than from FXStreet.
FXStreet and the author do not provide personalized recommendations. The author makes no representations as to the accuracy, completeness, or suitability of this information. FXStreet and the author will not be liable for any errors, omissions or any losses, injuries or damages arising from this information and its display or use. Errors and omissions excepted.
The author and FXStreet are not registered investment advisors and nothing in this article is intended to be investment advice.
Recommended content
Editors’ Picks
EUR/USD hovers around 1.0700 after German IFO data

EUR/USD stays in a consolidation phase at around 1.0700 in the European session on Wednesday. Upbeat IFO sentiment data from Germany helps the Euro hold its ground as market focus shifts to US Durable Goods Orders data.
USD/JPY refreshes 34-year high, attacks 155.00 as intervention risks loom

USD/JPY is renewing a multi-decade high, closing in on 155.00. Traders turn cautious on heightened risks of Japan's FX intervention. Broad US Dollar rebound aids the upside in the major. US Durable Goods data are next on tap.
Gold price trades with mild negative bias, manages to hold above $2,300 ahead of US data

Gold price (XAU/USD) edges lower during the early European session on Wednesday, albeit manages to hold its neck above the $2,300 mark and over a two-week low touched the previous day.
Worldcoin looks set for comeback despite Nvidia’s 22% crash Premium

Worldcoin price is in a better position than last week's and shows signs of a potential comeback. This development occurs amid the sharp decline in the valuation of the popular GPU manufacturer Nvidia.
Three fundamentals for the week: US GDP, BoJ and the Fed's favorite inflation gauge stand out Premium

While it is hard to predict when geopolitical news erupts, the level of tension is lower – allowing for key data to have its say. This week's US figures are set to shape the Federal Reserve's decision next week – and the Bank of Japan may struggle to halt the Yen's deterioration.