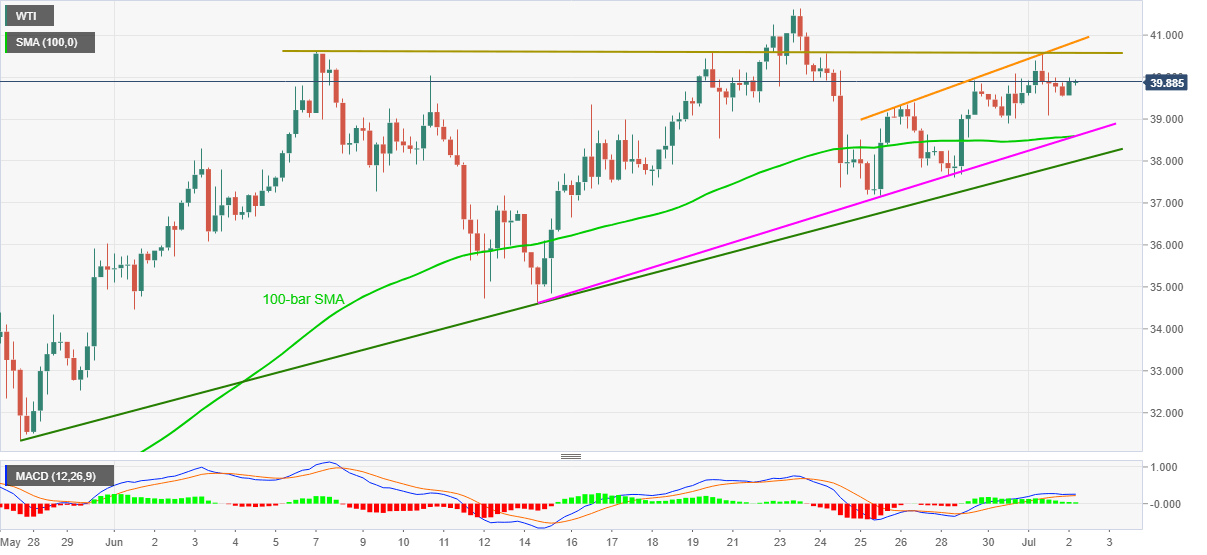
- WTI fails to respect the bounce off $39.53 while gaining around 0.20%.
- One-week-old resistance line offers immediate upside barrier.
- $38.60 and a five-week-old ascending trend line become the key support.
WTI recedes to $39.83, up 0.19% on a day, during the pre-European session on Thursday. The oil benchmark recently marked multiple failures to cross the $40.00 threshold. However, bullish MACD and upbeat formations on the four-hour chart keep buyers hopeful.
With this in mind, a horizontal line since the early June month, around $40.60, could lure the optimists beyond $40.00. Though, an ascending trend line from June 25, at $40.85 now, might challenge any further upside.
In a case where the oil prices manage to stay strong past-$40.85, the previous monthly top surrounding $41.65 and February month’s bottom close to $44.00 can return to the charts.
Alternatively, a confluence of 100-bar SMA and a rising trend line from June 15, near $38.60, followed by another support line from May 27 close to $38.00, can restrict the quote’s short-term downside.
If at all the black gold fail to bounce from $38.00, odds of its drop to the mid-June low surrounding $34.60 can’t be ruled out.
WTI four-hour chart
Trend: Sideways to positive
Information on these pages contains forward-looking statements that involve risks and uncertainties. Markets and instruments profiled on this page are for informational purposes only and should not in any way come across as a recommendation to buy or sell in these assets. You should do your own thorough research before making any investment decisions. FXStreet does not in any way guarantee that this information is free from mistakes, errors, or material misstatements. It also does not guarantee that this information is of a timely nature. Investing in Open Markets involves a great deal of risk, including the loss of all or a portion of your investment, as well as emotional distress. All risks, losses and costs associated with investing, including total loss of principal, are your responsibility. The views and opinions expressed in this article are those of the authors and do not necessarily reflect the official policy or position of FXStreet nor its advertisers. The author will not be held responsible for information that is found at the end of links posted on this page.
If not otherwise explicitly mentioned in the body of the article, at the time of writing, the author has no position in any stock mentioned in this article and no business relationship with any company mentioned. The author has not received compensation for writing this article, other than from FXStreet.
FXStreet and the author do not provide personalized recommendations. The author makes no representations as to the accuracy, completeness, or suitability of this information. FXStreet and the author will not be liable for any errors, omissions or any losses, injuries or damages arising from this information and its display or use. Errors and omissions excepted.
The author and FXStreet are not registered investment advisors and nothing in this article is intended to be investment advice.
Recommended content
Editors’ Picks
EUR/USD clings to daily gains above 1.0650

EUR/USD gained traction and turned positive on the day above 1.0650. The improvement seen in risk mood following the earlier flight to safety weighs on the US Dollar ahead of the weekend and helps the pair push higher.
GBP/USD recovers toward 1.2450 after UK Retail Sales data

GBP/USD reversed its direction and advanced to the 1.2450 area after touching a fresh multi-month low below 1.2400 in the Asian session. The positive shift seen in risk mood on easing fears over a deepening Iran-Israel conflict supports the pair.
Gold holds steady at around $2,380 following earlier spike

Gold stabilized near $2,380 after spiking above $2,400 with the immediate reaction to reports of Israel striking Iran. Meanwhile, the pullback seen in the US Treasury bond yields helps XAU/USD hold its ground.
Bitcoin Weekly Forecast: BTC post-halving rally could be partially priced in Premium

Bitcoin price shows no signs of directional bias while it holds above $60,000. The fourth BTC halving is partially priced in, according to Deutsche Bank’s research.
Week ahead – US GDP and BoJ decision on top of next week’s agenda

US GDP, core PCE and PMIs the next tests for the Dollar. Investors await BoJ for guidance about next rate hike. EU and UK PMIs, as well as Australian CPIs also on tap.