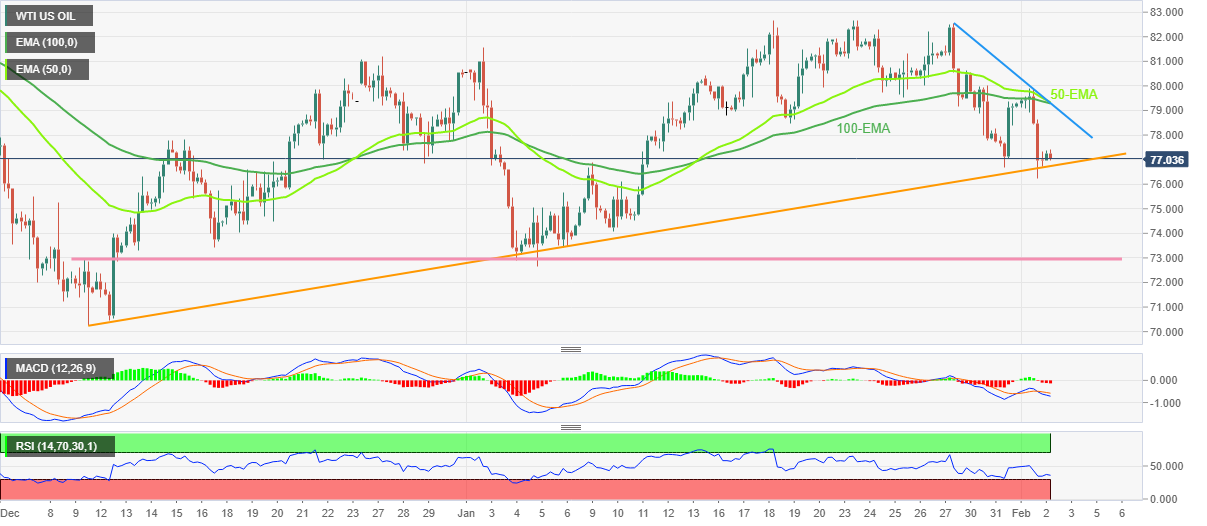
- WTI fades bounce off intraday low as sellers poke ascending support line from early December 2022.
- Downbeat MACD signals favor sellers but RSI conditions suggest limited room towards the south.
- Multiple EMAs, weekly resistance line highlight $79.30 as the key upside hurdle.
WTI crude oil holds lower ground near $77.00 as it retreats from its intraday high during early Thursday morning in Europe. In doing so, the black gold fades the late Monday’s corrective bounce off a three-week low.
The quote’s latest weakness takes clues from the bearish MACD signals and sustained trading below the key Exponential Moving Averages (EMAs).
However, an upward-sloping support line from early December 2022, close to $76.70 by the press time, challenges the WTI bears. On the same line could be the nearly oversold RSI (14).
It’s worth noting that a clear downside break of the aforementioned support line could quickly drag the quote toward two-month-old horizontal support near $73.00.
In a case where the Oil price remains bearish past $73.00, the late 2022 bottom surrounding $70.30 and the $70.00 psychological magnet will gain the market’s attention.
Meanwhile, the energy benchmark’s recovery moves remain elusive unless crossing the $79.30 resistance confluence, comprising the 100-EMA, 50-EMA and a one-week-old descending trend line.
Even if the WTI price crosses the $79.30 hurdle, the $80.00 round figure could act as a validation point for the rally targeting the previous monthly high near $82.70.
WTI: Four-hour chart
Trend: Limited downside expected
Information on these pages contains forward-looking statements that involve risks and uncertainties. Markets and instruments profiled on this page are for informational purposes only and should not in any way come across as a recommendation to buy or sell in these assets. You should do your own thorough research before making any investment decisions. FXStreet does not in any way guarantee that this information is free from mistakes, errors, or material misstatements. It also does not guarantee that this information is of a timely nature. Investing in Open Markets involves a great deal of risk, including the loss of all or a portion of your investment, as well as emotional distress. All risks, losses and costs associated with investing, including total loss of principal, are your responsibility. The views and opinions expressed in this article are those of the authors and do not necessarily reflect the official policy or position of FXStreet nor its advertisers. The author will not be held responsible for information that is found at the end of links posted on this page.
If not otherwise explicitly mentioned in the body of the article, at the time of writing, the author has no position in any stock mentioned in this article and no business relationship with any company mentioned. The author has not received compensation for writing this article, other than from FXStreet.
FXStreet and the author do not provide personalized recommendations. The author makes no representations as to the accuracy, completeness, or suitability of this information. FXStreet and the author will not be liable for any errors, omissions or any losses, injuries or damages arising from this information and its display or use. Errors and omissions excepted.
The author and FXStreet are not registered investment advisors and nothing in this article is intended to be investment advice.
Recommended content
Editors’ Picks
EUR/USD clings to daily gains above 1.0650

EUR/USD gained traction and turned positive on the day above 1.0650. The improvement seen in risk mood following the earlier flight to safety weighs on the US Dollar ahead of the weekend and helps the pair push higher.
GBP/USD recovers toward 1.2450 after UK Retail Sales data

GBP/USD reversed its direction and advanced to the 1.2450 area after touching a fresh multi-month low below 1.2400 in the Asian session. The positive shift seen in risk mood on easing fears over a deepening Iran-Israel conflict supports the pair.
Gold holds steady at around $2,380 following earlier spike

Gold stabilized near $2,380 after spiking above $2,400 with the immediate reaction to reports of Israel striking Iran. Meanwhile, the pullback seen in the US Treasury bond yields helps XAU/USD hold its ground.
Bitcoin Weekly Forecast: BTC post-halving rally could be partially priced in Premium

Bitcoin price shows no signs of directional bias while it holds above $60,000. The fourth BTC halving is partially priced in, according to Deutsche Bank’s research.
Week ahead – US GDP and BoJ decision on top of next week’s agenda

US GDP, core PCE and PMIs the next tests for the Dollar. Investors await BoJ for guidance about next rate hike. EU and UK PMIs, as well as Australian CPIs also on tap.