Mondelez technical analysis summary
Sell Stop: Below 57.79.
Stop Loss: Above 63.29.
| Indicator | Signal |
| RSI | Neutral |
| MACD | Buy |
| Donchian Channel | Neutral |
| MA(200) | Sell |
| Fractals | Sell |
| Parabolic SAR | Sell |
Mondelez chart analysis
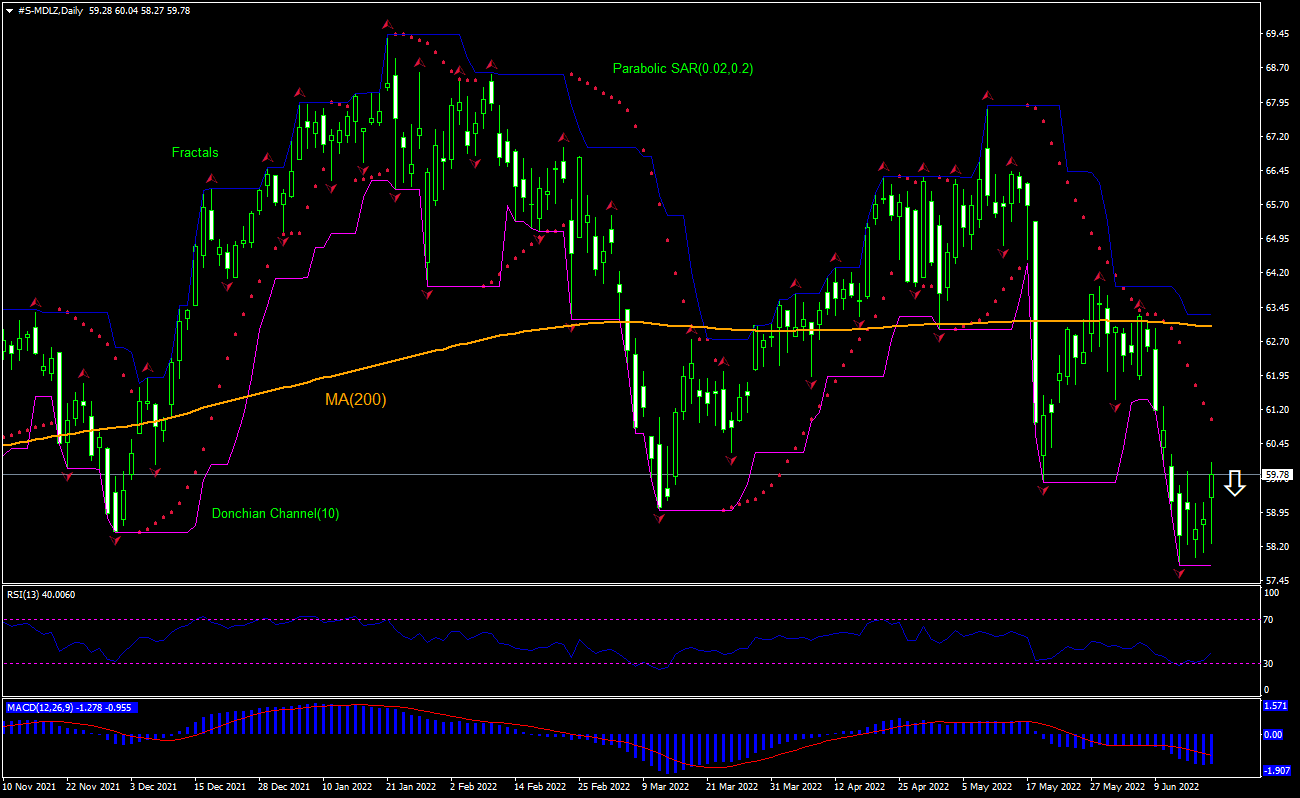
The technical analysis of the Mondelez International stock price chart on daily timeframe shows #S-MDLZ,Daily is falling under the 200-day moving average MA(200) which is declining. We believe the bearish momentum will continue after the price breaches below the lower boundary of Donchian channel at 57.79. This level can be used as an entry point for placing a pending order to sell. The stop loss can be placed above the fractal high at 63.29. After placing the order, the stop loss is to be moved every day to the next fractal high, following Parabolic indicator signals. Thus, we are changing the expected profit/loss ratio to the breakeven point. If the price meets the stop loss level (63.29) without reaching the order (57.79), we recommend cancelling the order: the market has undergone internal changes which were not taken into account.
Fundamental analysis of stocks – Mondelez
Mondelez International stock gained after the news company is acquiring energy bar maker Clif Bar & Company. Will the Mondelez International stock price retreating reverse?
Mondelez International, Inc. is an American multinational company which manufactures and sells snack food and beverage products globally. Company’s market capitalization is $81.4 billion. Mondelez International’s stock trades at price-to-earnings (P/E) ratio of 19.78 for trailing twelve months (ttm). Over the past 12 months, it has generated revenue of $29.25 billion, Return on Assets (ttm) of 4.65% and Return on Equity (ttm) 15.20%. Mondelez International Inc said on Monday it will buy energy bar maker Clif Bar & Company for $2.9 billion to expand its global snack bar business. Clif Bar's acquisition marks the ninth deal since 2018. Mondelez said the company will also pay additional amounts to the sellers depending upon its earnings from Clif Bar. Stock price closed up 1.73% over day after the news
Want to get more free analytics? Open Demo Account now to get daily news and analytical materials.
This overview has an informative character and is not financial advice or a recommendation. IFCMarkets. Corp. under any circumstances is not liable for any action taken by someone else after reading this article.
Recommended content
Editors’ Picks
EUR/USD regains traction, recovers above 1.0700

EUR/USD regained its traction and turned positive on the day above 1.0700 in the American session. The US Dollar struggles to preserve its strength after the data from the US showed that the economy grew at a softer pace than expected in Q1.
GBP/USD returns to 1.2500 area in volatile session

GBP/USD reversed its direction and recovered to 1.2500 after falling to the 1.2450 area earlier in the day. Although markets remain risk-averse, the US Dollar struggles to find demand following the disappointing GDP data.
Gold climbs above $2,340 following earlier drop

Gold fell below $2,320 in the early American session as US yields shot higher after the data showed a significant increase in the US GDP price deflator in Q1. With safe-haven flows dominating the markets, however, XAU/USD reversed its direction and rose above $2,340.
XRP extends its decline, crypto experts comment on Ripple stablecoin and benefits for XRP Ledger

Ripple extends decline to $0.52 on Thursday, wipes out weekly gains. Crypto expert asks Ripple CTO how the stablecoin will benefit the XRP Ledger and native token XRP.
After the US close, it’s the Tokyo CPI

After the US close, it’s the Tokyo CPI, a reliable indicator of the national number and then the BoJ policy announcement. Tokyo CPI ex food and energy in Japan was a rise to 2.90% in March from 2.50%.