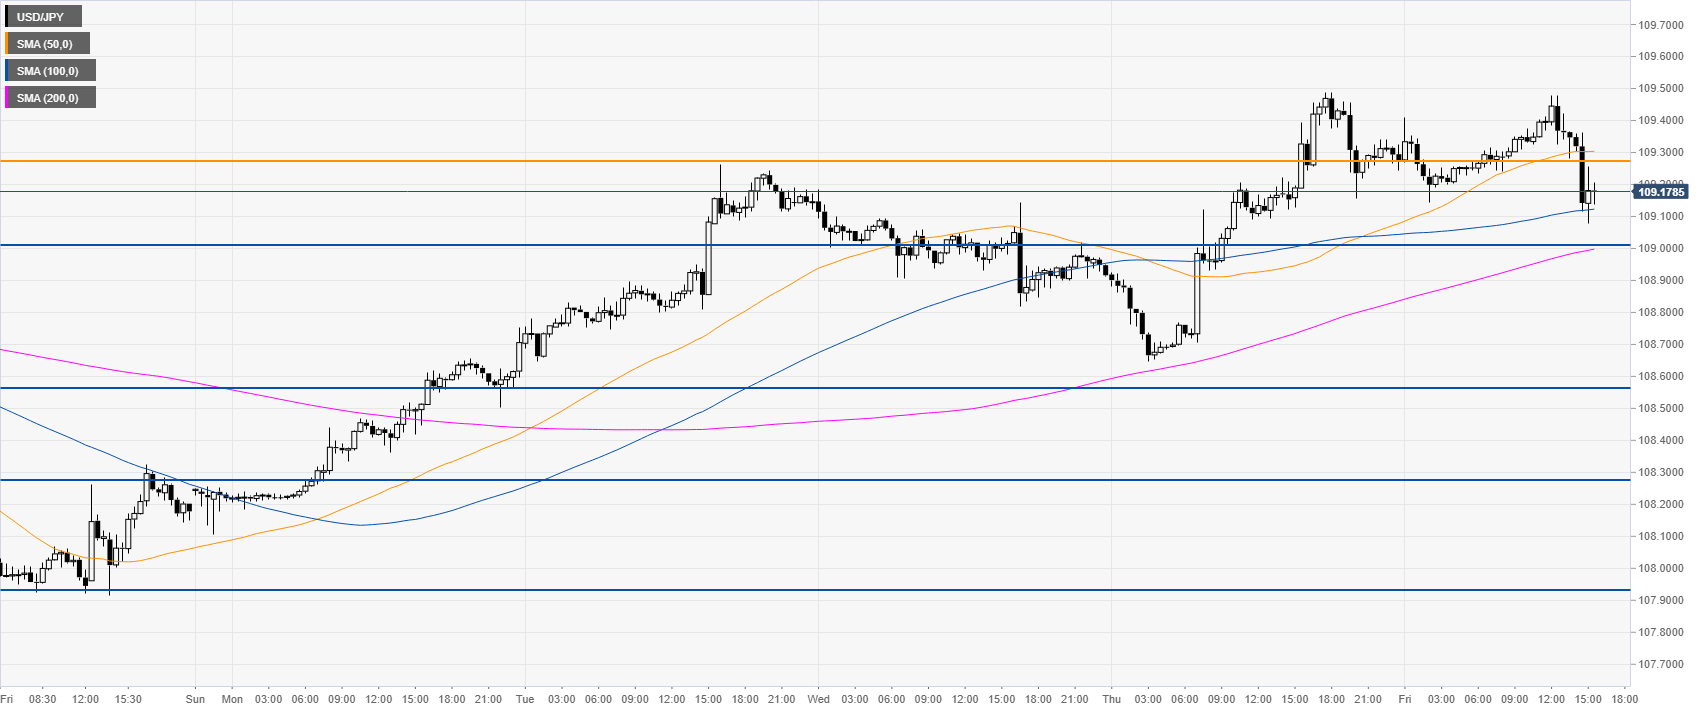
- USD/JPY dropped to daily fresh daily lows however still holding onto weekly gains.
- The level to beat for buyers is the 109.29 resistance.
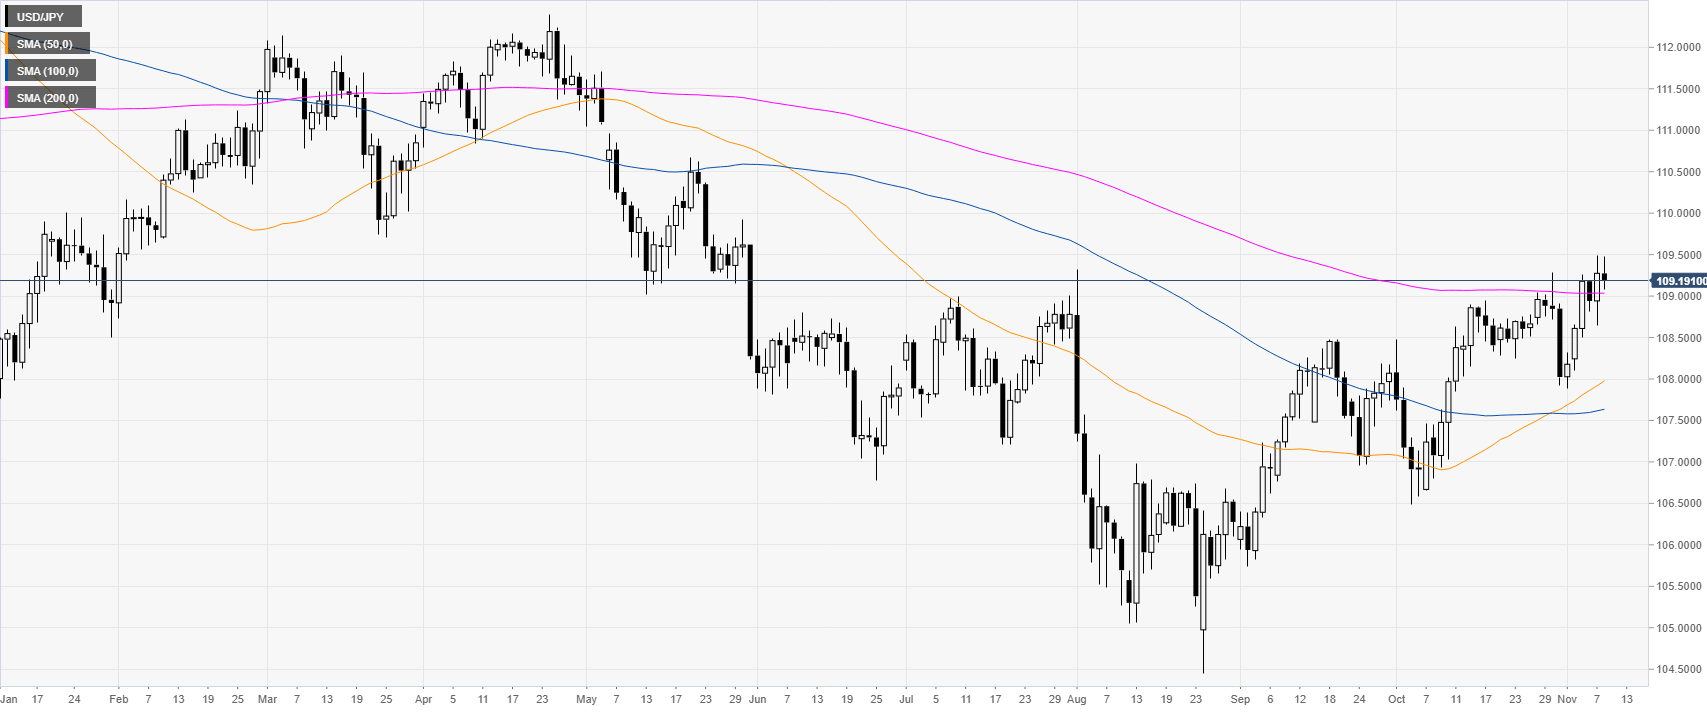
USD/JPY daily chart
USD/JPY is trading above the 109.00 handle and the 200-day simple moving average (SMA) on the daily chart. In the last two months the market has been gaining considerable momentum.
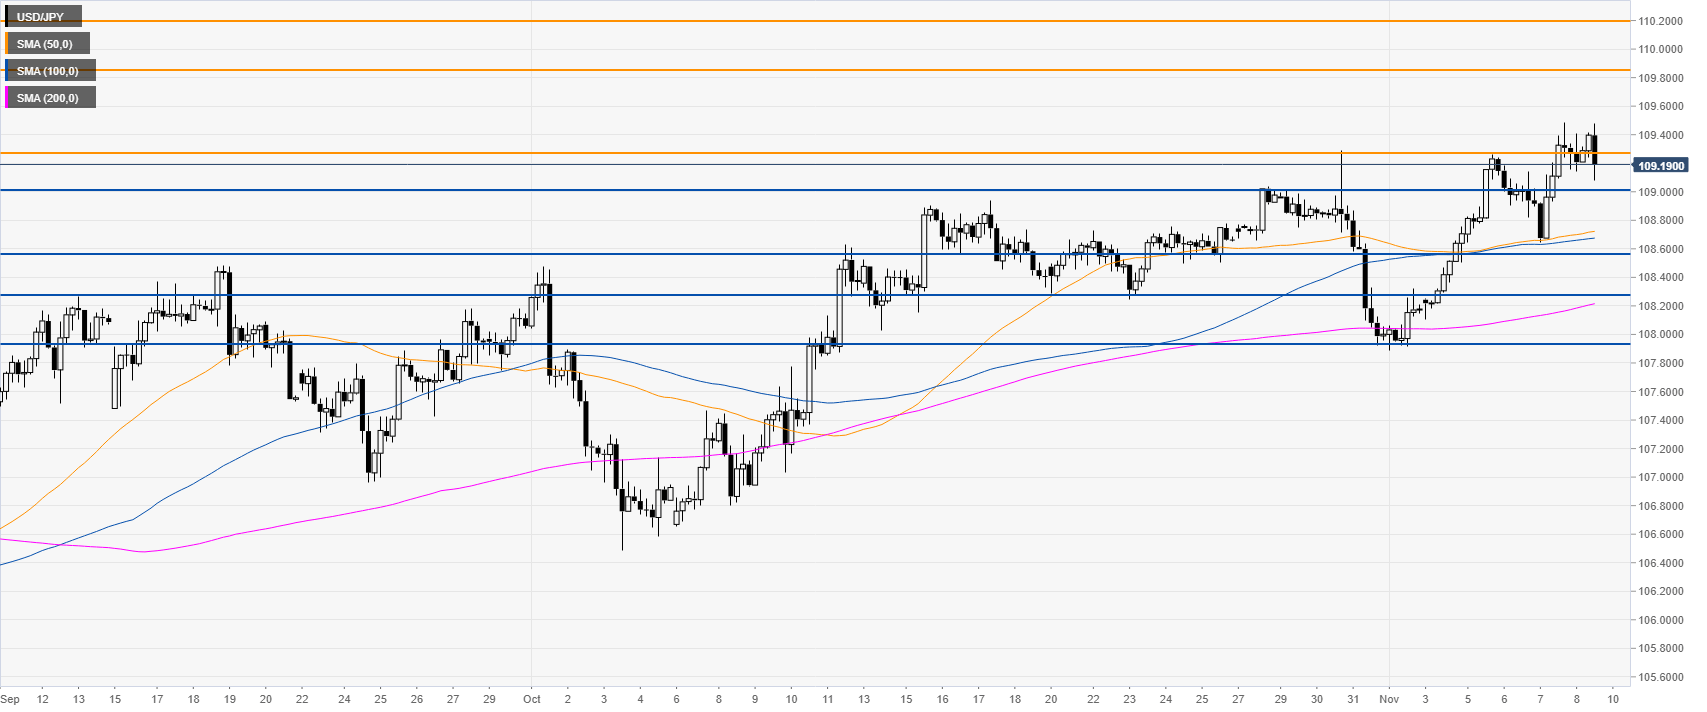
USD/JPY four-hour chart
The spot is trading above its main SMAs on the four-hour chart, suggesting a bullish bias in the medium term. The market is battling with the 109.29 resistance, now trading just below it. Resistances on the way up are seen at the 109.85 and 110.20 price levels, according to the Technical Confluences Indicator.
USD/JPY 30-minute chart
USD/JPY is trading above the upward sloping 100 and 200 SMAs, suggesting a bullish momentum in the near term. Support is seen at the 109.00 figure followed by the 108.55 and 108.27 levels, according to the Technical Confluences Indicator.
Additional key levels
Note: All information on this page is subject to change. The use of this website constitutes acceptance of our user agreement. Please read our privacy policy and legal disclaimer. Opinions expressed at FXstreet.com are those of the individual authors and do not necessarily represent the opinion of FXstreet.com or its management. Risk Disclosure: Trading foreign exchange on margin carries a high level of risk, and may not be suitable for all investors. The high degree of leverage can work against you as well as for you. Before deciding to invest in foreign exchange you should carefully consider your investment objectives, level of experience, and risk appetite. The possibility exists that you could sustain a loss of some or all of your initial investment and therefore you should not invest money that you cannot afford to lose. You should be aware of all the risks associated with foreign exchange trading, and seek advice from an independent financial advisor if you have any doubts.
Recommended content
Editors’ Picks
GBP/USD slides to its lowest level since November, eyes 1.2400 ahead of UK jobs data

GBP/USD drifts lower for the third straight day on Tuesday and drops to its lowest level since November 17 during the Asian session. Spot prices trade around the 1.2420 region as traders now look to the UK monthly employment details for a fresh impetus.
EUR/USD falls toward 1.0600 on higher expectations of the Fed prolonging higher rates

EUR/USD continues to lose ground for the sixth successive session, trading near 1.0610 during the Asian hours on Tuesday. The elevated US Dollar is exerting pressure on the pair, potentially influenced by the higher US Treasury yields.
Gold price holds steady below $2,400 mark, bullish potential seems intact

Gold price oscillates in a narrow band on Tuesday and remains close to the all-time peak. The worsening Middle East crisis weighs on investors’ sentiment and benefits the metal. Reduced Fed rate cut bets lift the USD to a fresh YTD top and cap gains for the XAU/USD.
SOL primed for a breakout as it completes a rounding bottom pattern

Solana price has conformed to the broader market crash, following in the steps of Bitcoin price that remains in the red below the $65,000 threshold. For SOL, however, the sensational altcoin could have a big move in store.
The week ahead: Key economic and earnings releases to watch

The market’s focus may be on geopolitical issues at the start of this week, but there is a large amount of economic data and more earnings releases to digest in the coming days.