USD/JPY daily chart
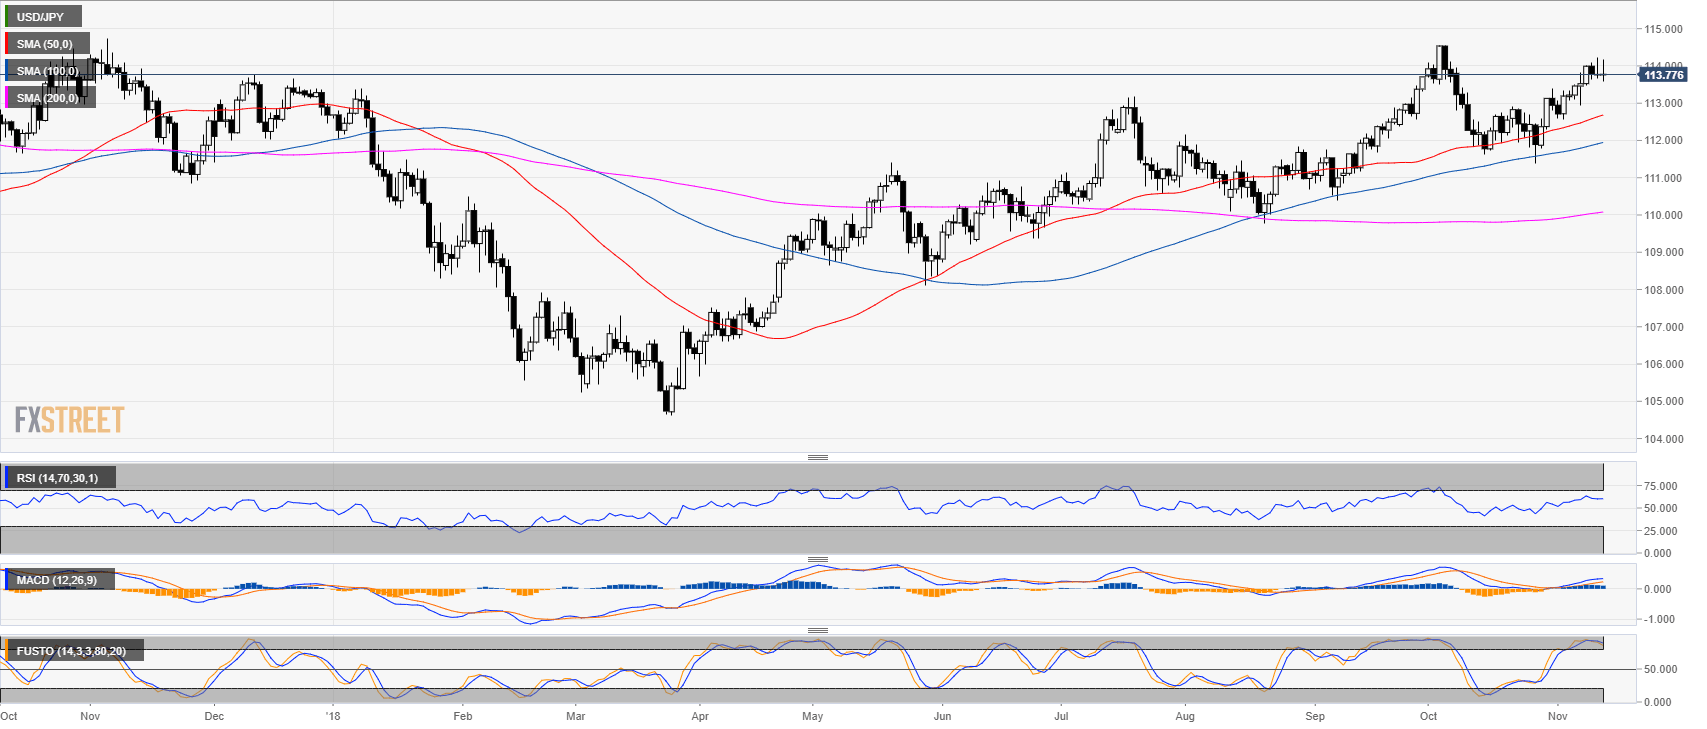
- USD/JPY is consolidating near the 114.00 figure for the fourth day in a row.
- The Stochastic indicator is in the overbought zone.
USD/JPY 4-hour chart
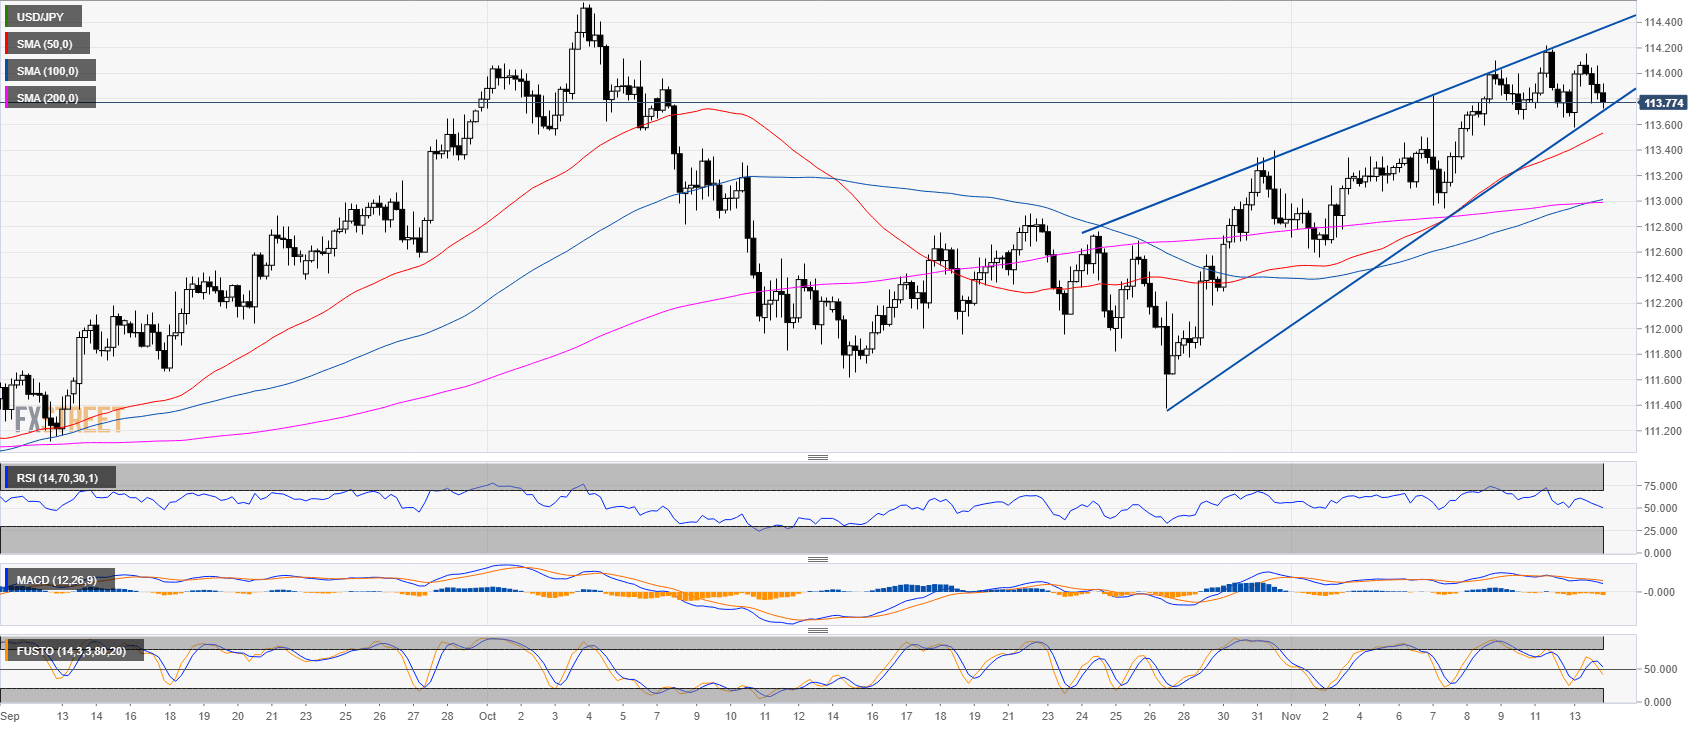
- USD/JPY is trading in a bull trend above the 200-period simple moving average (SMA).
- USD/JPY has formed a potentially bearish wedge.
- Technical indicators are decelerating.
USD/JPY 30-minute chart
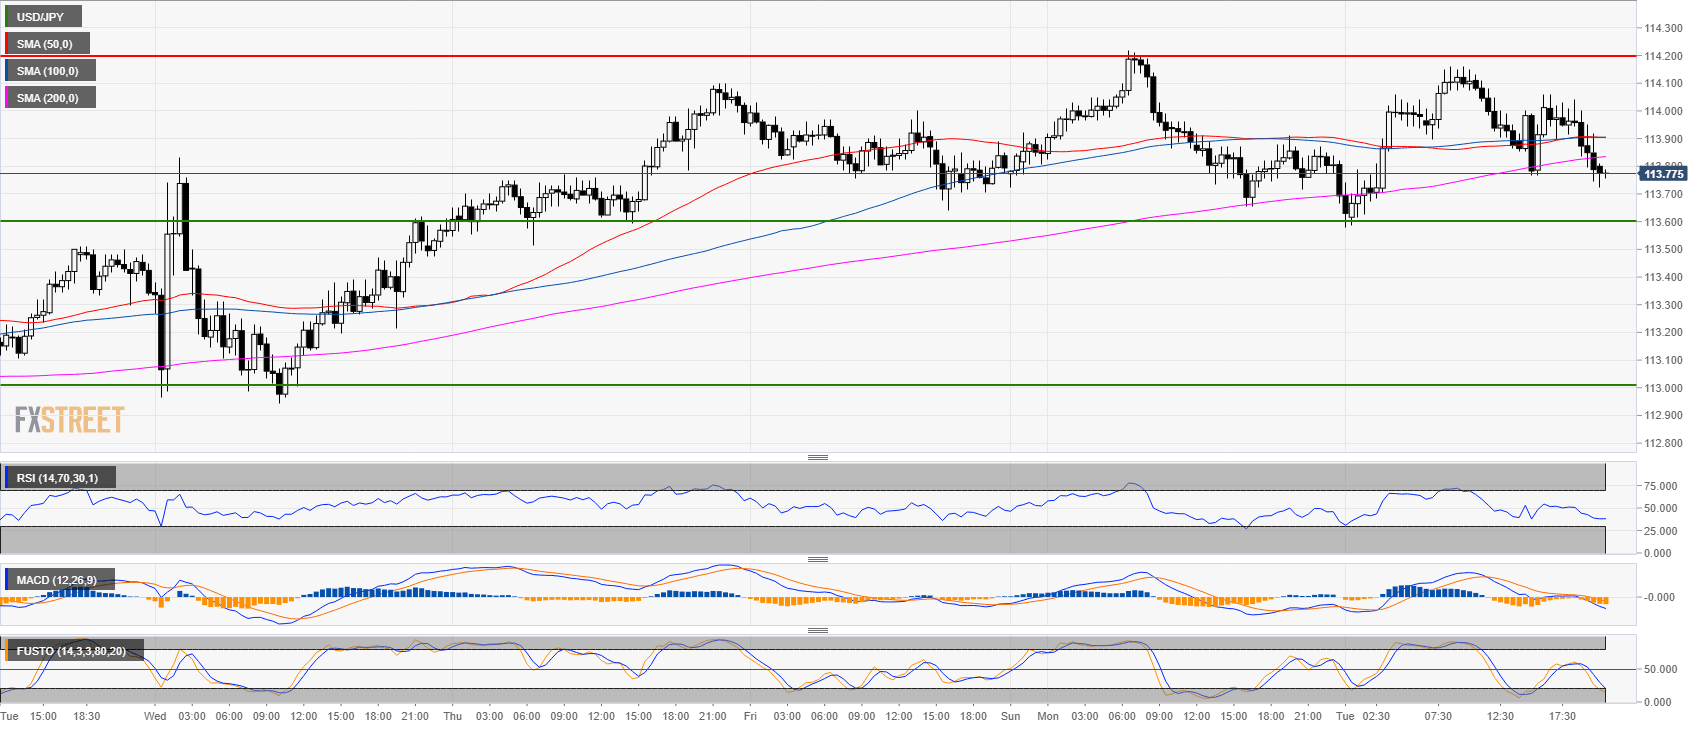
- Bulls need a break above 114.20.
- If bears break below 113.60 support it can open the door to 113.00 figure.
- Bears have a slight advantage.
Additional key levels at a glance:
USD/JPY
Overview:
Last Price: 113.77
Daily change: 1.0 pips
Daily change: 0.00879%
Daily Open: 113.76
Trends:
Daily SMA20: 112.88
Daily SMA50: 112.64
Daily SMA100: 111.91
Daily SMA200: 110.06
Levels:
Daily High: 114.22
Daily Low: 113.66
Weekly High: 114.1
Weekly Low: 112.94
Monthly High: 114.56
Monthly Low: 111.38
Daily Fibonacci 38.2%: 113.87
Daily Fibonacci 61.8%: 114
Daily Pivot Point S1: 113.54
Daily Pivot Point S2: 113.31
Daily Pivot Point S3: 112.97
Daily Pivot Point R1: 114.1
Daily Pivot Point R2: 114.44
Daily Pivot Point R3: 114.67
Note: All information on this page is subject to change. The use of this website constitutes acceptance of our user agreement. Please read our privacy policy and legal disclaimer. Opinions expressed at FXstreet.com are those of the individual authors and do not necessarily represent the opinion of FXstreet.com or its management. Risk Disclosure: Trading foreign exchange on margin carries a high level of risk, and may not be suitable for all investors. The high degree of leverage can work against you as well as for you. Before deciding to invest in foreign exchange you should carefully consider your investment objectives, level of experience, and risk appetite. The possibility exists that you could sustain a loss of some or all of your initial investment and therefore you should not invest money that you cannot afford to lose. You should be aware of all the risks associated with foreign exchange trading, and seek advice from an independent financial advisor if you have any doubts.
Recommended content
Editors’ Picks
EUR/USD regains traction, recovers above 1.0700

EUR/USD regained its traction and turned positive on the day above 1.0700 in the American session. The US Dollar struggles to preserve its strength after the data from the US showed that the economy grew at a softer pace than expected in Q1.
GBP/USD returns to 1.2500 area in volatile session

GBP/USD reversed its direction and recovered to 1.2500 after falling to the 1.2450 area earlier in the day. Although markets remain risk-averse, the US Dollar struggles to find demand following the disappointing GDP data.
Gold climbs above $2,340 following earlier drop

Gold fell below $2,320 in the early American session as US yields shot higher after the data showed a significant increase in the US GDP price deflator in Q1. With safe-haven flows dominating the markets, however, XAU/USD reversed its direction and rose above $2,340.
XRP extends its decline, crypto experts comment on Ripple stablecoin and benefits for XRP Ledger

Ripple extends decline to $0.52 on Thursday, wipes out weekly gains. Crypto expert asks Ripple CTO how the stablecoin will benefit the XRP Ledger and native token XRP.
After the US close, it’s the Tokyo CPI

After the US close, it’s the Tokyo CPI, a reliable indicator of the national number and then the BoJ policy announcement. Tokyo CPI ex food and energy in Japan was a rise to 2.90% in March from 2.50%.