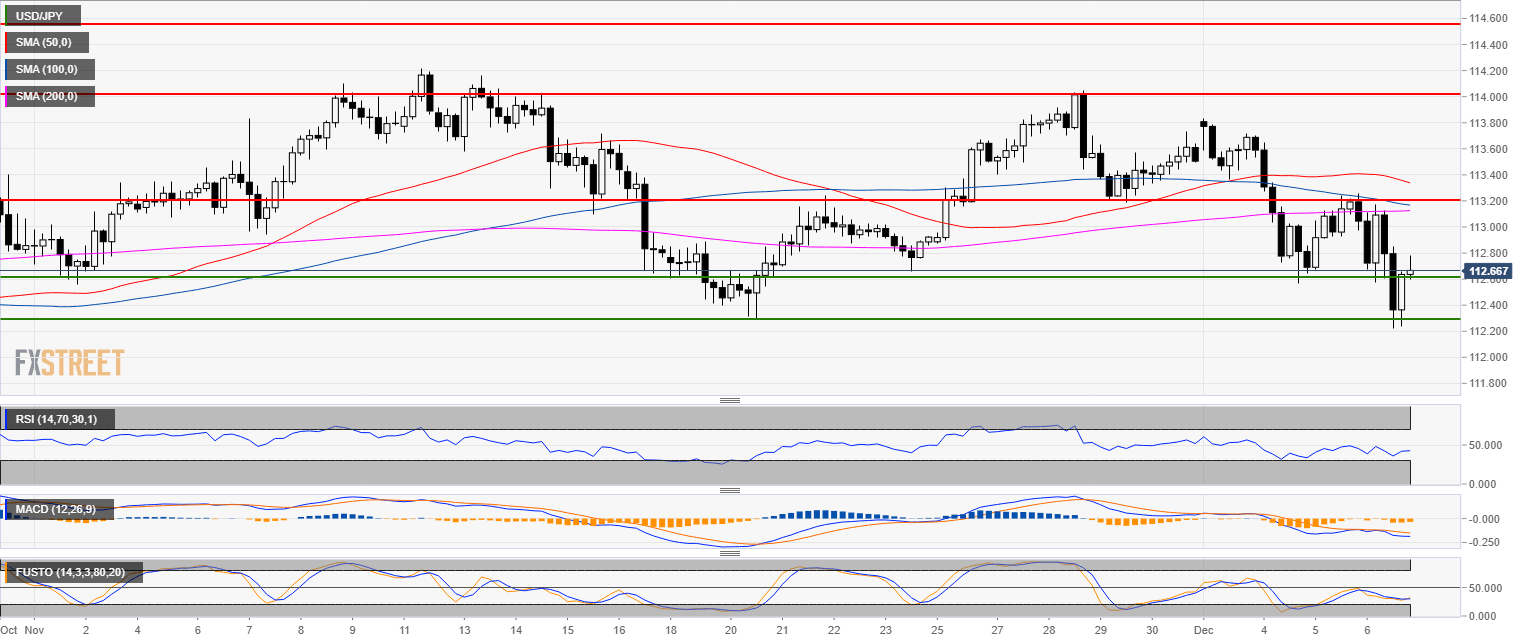
USD/JPY daily chart
- USD/JPY is in a bull trend above the 200-day simple moving average (SMA).
- As forecast, USD/JPY hit the 112.60 target.

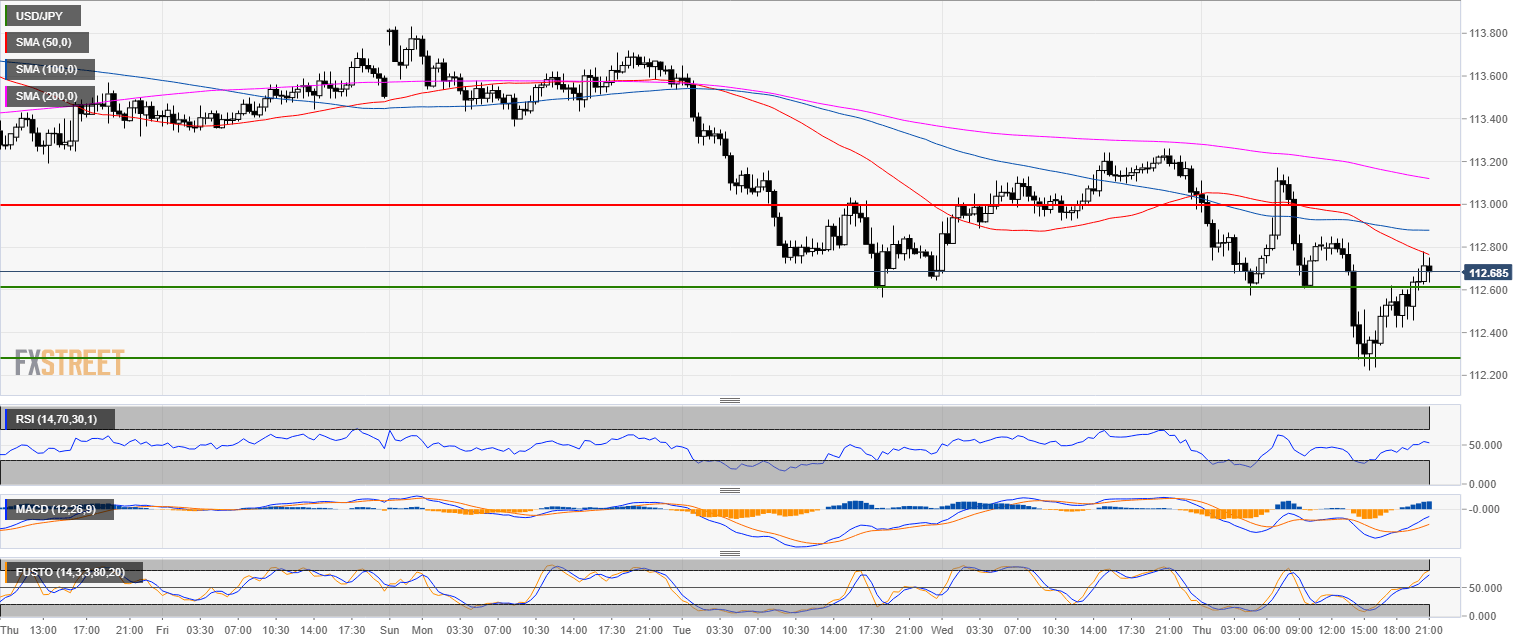
USD/JPY 4-hour chart
- USD/JPY is trading below its main SMAs.
- USD/JPY found some support at the November lows and the 112.20 level.
USD/JPY 30-minute chart
- USD/JPY found some short-term resistance at the 50 SMA.
- The next bull target should be the 113.00 figure.
Additional key levels
USD/JPY
Overview:
Today Last Price: 112.68
Today Daily change: -54 pips
Today Daily change %: -0.477%
Today Daily Open: 113.22
Trends:
Previous Daily SMA20: 113.35
Previous Daily SMA50: 113.09
Previous Daily SMA100: 112.25
Previous Daily SMA200: 110.52
Levels:
Previous Daily High: 113.24
Previous Daily Low: 112.65
Previous Weekly High: 114.04
Previous Weekly Low: 112.88
Previous Monthly High: 114.25
Previous Monthly Low: 112.3
Previous Daily Fibonacci 38.2%: 113.02
Previous Daily Fibonacci 61.8%: 112.88
Previous Daily Pivot Point S1: 112.83
Previous Daily Pivot Point S2: 112.44
Previous Daily Pivot Point S3: 112.24
Previous Daily Pivot Point R1: 113.43
Previous Daily Pivot Point R2: 113.63
Previous Daily Pivot Point R3: 114.02
Note: All information on this page is subject to change. The use of this website constitutes acceptance of our user agreement. Please read our privacy policy and legal disclaimer. Opinions expressed at FXstreet.com are those of the individual authors and do not necessarily represent the opinion of FXstreet.com or its management. Risk Disclosure: Trading foreign exchange on margin carries a high level of risk, and may not be suitable for all investors. The high degree of leverage can work against you as well as for you. Before deciding to invest in foreign exchange you should carefully consider your investment objectives, level of experience, and risk appetite. The possibility exists that you could sustain a loss of some or all of your initial investment and therefore you should not invest money that you cannot afford to lose. You should be aware of all the risks associated with foreign exchange trading, and seek advice from an independent financial advisor if you have any doubts.
Recommended content
Editors’ Picks
AUD/USD tumbles toward 0.6350 as Middle East war fears mount

AUD/USD has come under intense selling pressure and slides toward 0.6350, as risk-aversion intensifies following the news that Israel retaliated with missile strikes on a site in Iran. Fears of the Israel-Iran strife translating into a wider regional conflict are weighing on the higher-yielding Aussie Dollar.
USD/JPY breaches 154.00 as sell-off intensifies on Israel-Iran escalation

USD/JPY is trading below 154.00 after falling hard on confirmation of reports of an Israeli missile strike on Iran, implying that an open conflict is underway and could only spread into a wider Middle East war. Safe-haven Japanese Yen jumped, helped by BoJ Governor Ueda's comments.
Gold price jumps above $2,400 as MidEast escalation sparks flight to safety

Gold price has caught a fresh bid wave, jumping beyond $2,400 after Israel's retaliatory strikes on Iran sparked a global flight to safety mode and rushed flows into the ultimate safe-haven Gold. Risk assets are taking a big hit, as risk-aversion creeps into Asian trading on Friday.
WTI surges to $85.00 amid Israel-Iran tensions

Western Texas Intermediate, the US crude oil benchmark, is trading around $85.00 on Friday. The black gold gains traction on the day amid the escalating tension between Israel and Iran after a US official confirmed that Israeli missiles had hit a site in Iran.
Dogwifhat price pumps 5% ahead of possible Coinbase effect

Dogwifhat price recorded an uptick on Thursday, going as far as to outperform its peers in the meme coins space. Second only to Bonk Inu, WIF token’s show of strength was not just influenced by Bitcoin price reclaiming above $63,000.