- USD/INR rebounds for the second straight day on Friday, despite DXY’s weakness.
- Despite the bounce, the pair is in a bearish consolidation phase.
- Has the spot found a near-term bottom near the 73.75 area?
USD/INR is looking to build onto its previous rebound from near four-month troughs of 73.73, as bulls yearn for acceptance above the 74.00 mark.
The ongoing weakness in the US dollar fails to have any impact on the pair’s recovery, as the sentiment around the Indian rupee deteriorated amid the surging coronavirus case in the world’s second-largest populous country.
India reports a 264,202 daily rise in coronavirus infections this Friday, the highest since May 20, against 247,147 reported on Thursday.
Meanwhile, the minor correction in oil prices is also ignored by INR bulls, as the road to recovery extends ahead of the US Retail Sales release.
At the time of writing, the spot is trading close to the daily lows of 74.00, eyeing a sustained move above the latter.
Bulls will then see a fresh upswing towards the horizontal 200-Daily Moving Average (DMA) at 74.28, above which the 100-DMA at 74.53 will get tested.
Further up, the January high of 74.69 will be on buyers’ radars.
USD/INR: Daily chart
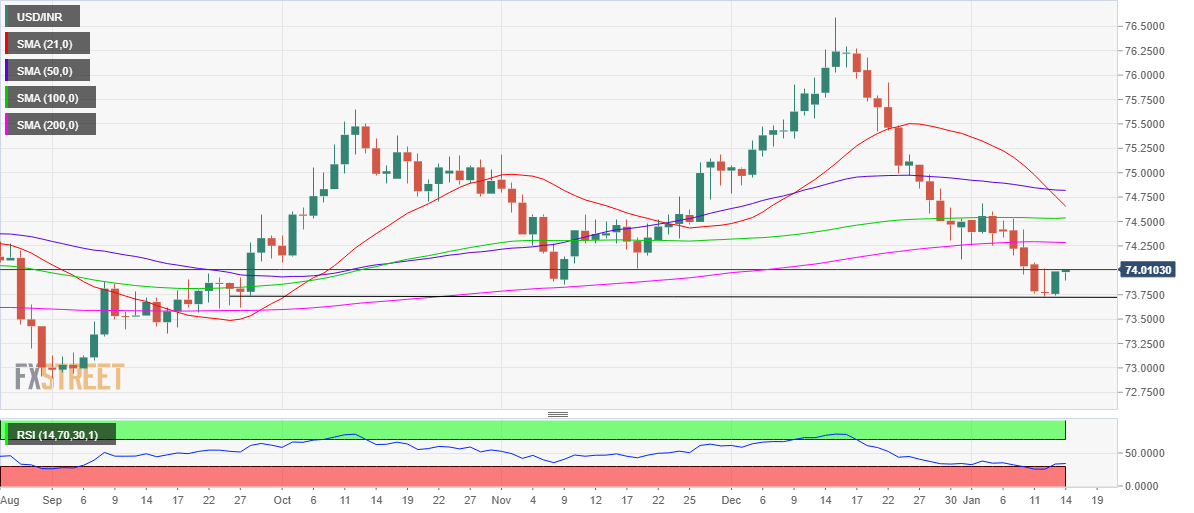
The 14-day Relative Strength Index (RSI), however, remains below the midline while recovering from the oversold territory, suggesting that the bearish bias remains intact in the near term.
The immediate cushion is seen at the November 9 lows of 73.85. The four-month lows will be back in the spotlight if the latter caves into the bearish pressures.
USD/INR: Additional levels
Information on these pages contains forward-looking statements that involve risks and uncertainties. Markets and instruments profiled on this page are for informational purposes only and should not in any way come across as a recommendation to buy or sell in these assets. You should do your own thorough research before making any investment decisions. FXStreet does not in any way guarantee that this information is free from mistakes, errors, or material misstatements. It also does not guarantee that this information is of a timely nature. Investing in Open Markets involves a great deal of risk, including the loss of all or a portion of your investment, as well as emotional distress. All risks, losses and costs associated with investing, including total loss of principal, are your responsibility. The views and opinions expressed in this article are those of the authors and do not necessarily reflect the official policy or position of FXStreet nor its advertisers. The author will not be held responsible for information that is found at the end of links posted on this page.
If not otherwise explicitly mentioned in the body of the article, at the time of writing, the author has no position in any stock mentioned in this article and no business relationship with any company mentioned. The author has not received compensation for writing this article, other than from FXStreet.
FXStreet and the author do not provide personalized recommendations. The author makes no representations as to the accuracy, completeness, or suitability of this information. FXStreet and the author will not be liable for any errors, omissions or any losses, injuries or damages arising from this information and its display or use. Errors and omissions excepted.
The author and FXStreet are not registered investment advisors and nothing in this article is intended to be investment advice.
Recommended content
Editors’ Picks
EUR/USD regains traction, recovers above 1.0700

EUR/USD regained its traction and turned positive on the day above 1.0700 in the American session. The US Dollar struggles to preserve its strength after the data from the US showed that the economy grew at a softer pace than expected in Q1.
GBP/USD returns to 1.2500 area in volatile session

GBP/USD reversed its direction and recovered to 1.2500 after falling to the 1.2450 area earlier in the day. Although markets remain risk-averse, the US Dollar struggles to find demand following the disappointing GDP data.
Gold holds around $2,330 after dismal US data

Gold fell below $2,320 in the early American session as US yields shot higher after the data showed a significant increase in the US GDP price deflator in Q1. With safe-haven flows dominating the markets, however, XAU/USD reversed its direction and rose above $2,340.
XRP extends its decline, crypto experts comment on Ripple stablecoin and benefits for XRP Ledger

Ripple extends decline to $0.52 on Thursday, wipes out weekly gains. Crypto expert asks Ripple CTO how the stablecoin will benefit the XRP Ledger and native token XRP.
After the US close, it’s the Tokyo CPI

After the US close, it’s the Tokyo CPI, a reliable indicator of the national number and then the BoJ policy announcement. Tokyo CPI ex food and energy in Japan was a rise to 2.90% in March from 2.50%.