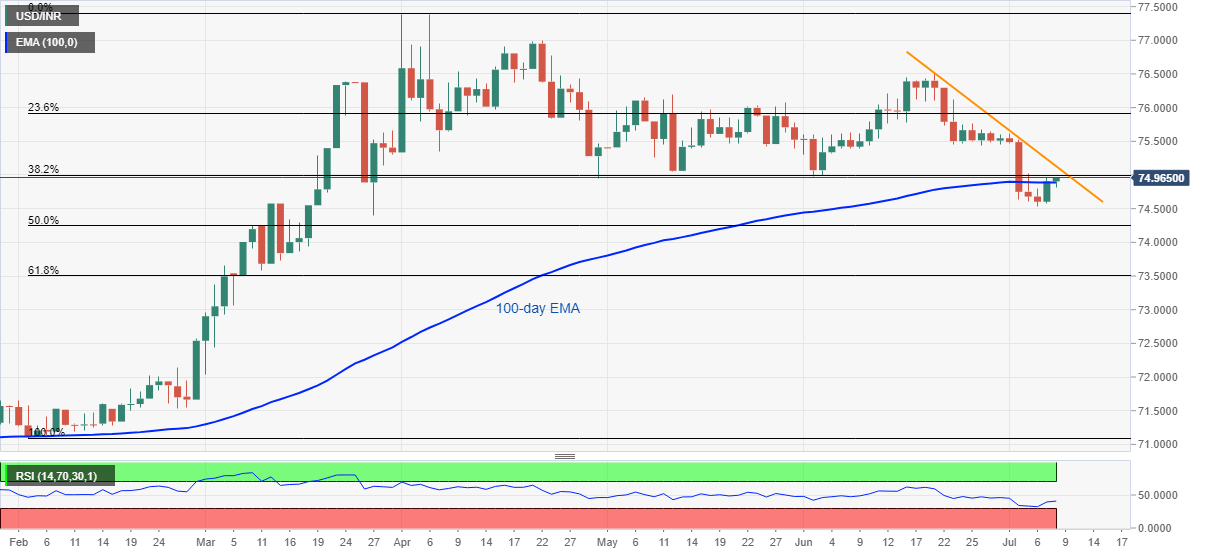
- USD/INR again confronts 38.2% Fibonacci retracement after piercing 100-day EMA.
- The pair’s repeated failures to cross the key Fibonacci retracement level comprising lows marked since April favor the sellers.
- Bulls will look for entry beyond a descending trend line from June 19.
USD/INR takes the bids near 74.96, up 0.08% during the initial hours of Indian session on Wednesday. In doing so, the quote extends Tuesday’s pullback moves while staying below 38.2% Fibonacci retracement of February-April upside. Additionally, the pair’s latest break above 100-day EMA level near 74.90, makes it hopeful to again attack the key resistance.
Should the USD/INR prices offer a daily closing beyond 75.00 mark, comprising 38.2% Fibonacci retracement, it can challenge the falling trend line from June 19, at 75.13 now. Though, the pair’s further upside will be compressed by 75.45 and multiple tops marked during the May month around 76.20.
It should also be noted that the pair’s ability to cross 76.20 on a daily basis will quickly attack June month’s top around 76.50.
On the downside, a daily close below 100-day EMA level of 74.90 may recall the weekly bottom, also the lowest since March 27, nearing 74.50.
Though, the pair’s additional weakness will be questioned by 50% and 61.8% Fibonacci retracement levels of 74.25 and 73.50 respectively.
USD/INR daily chart
Trend: Further recovery expected
Information on these pages contains forward-looking statements that involve risks and uncertainties. Markets and instruments profiled on this page are for informational purposes only and should not in any way come across as a recommendation to buy or sell in these assets. You should do your own thorough research before making any investment decisions. FXStreet does not in any way guarantee that this information is free from mistakes, errors, or material misstatements. It also does not guarantee that this information is of a timely nature. Investing in Open Markets involves a great deal of risk, including the loss of all or a portion of your investment, as well as emotional distress. All risks, losses and costs associated with investing, including total loss of principal, are your responsibility. The views and opinions expressed in this article are those of the authors and do not necessarily reflect the official policy or position of FXStreet nor its advertisers. The author will not be held responsible for information that is found at the end of links posted on this page.
If not otherwise explicitly mentioned in the body of the article, at the time of writing, the author has no position in any stock mentioned in this article and no business relationship with any company mentioned. The author has not received compensation for writing this article, other than from FXStreet.
FXStreet and the author do not provide personalized recommendations. The author makes no representations as to the accuracy, completeness, or suitability of this information. FXStreet and the author will not be liable for any errors, omissions or any losses, injuries or damages arising from this information and its display or use. Errors and omissions excepted.
The author and FXStreet are not registered investment advisors and nothing in this article is intended to be investment advice.
Recommended content
Editors’ Picks
GBP/USD stays weak near 1.2400 after UK Retail Sales data

GBP/USD stays vulnerable near 1.2400 early Friday, sitting at five-month troughs. The UK Retail Sales data came in mixed and added to the weakness in the pair. Risk-aversion on the Middle East escalation keeps the pair on the back foot.
EUR/USD extends its downside below 1.0650 on hawkish Fed remarks

The EUR/USD extends its downside around 1.0640 after retreating from weekly peaks of 1.0690 on Friday. The hawkish comments from Federal Reserve officials provide some support to the US Dollar.
Gold: Middle East war fears spark fresh XAU/USD rally, will it sustain?

Gold price is trading close to $2,400 early Friday, reversing from a fresh five-day high reached at $2,418 earlier in the Asian session. Despite the pullback, Gold price remains on track to book the fifth weekly gain in a row.
Bitcoin Price Outlook: All eyes on BTC as CNN calls halving the ‘World Cup for Bitcoin’

Bitcoin price remains the focus of traders and investors ahead of the halving, which is an important event expected to kick off the next bull market. Amid conflicting forecasts from analysts, an international media site has lauded the halving and what it means for the industry.
Israel vs. Iran: Fear of escalation grips risk markets

Recent reports of an Israeli aerial bombardment targeting a key nuclear facility in central Isfahan have sparked a significant shift out of risk assets and into safe-haven investments.