- USD/INR extends weakness from 75.57, snaps four-day winning streak.
- 11-week-old horizontal support grabs bears’ immediate attention, bulls will have a bumpy road ahead.
- Normal RSI suggests the pullback to fade momentum once reaching the nearby support.
USD/INR drops to 75.28, down 0.05% on a day, ahead of the European session on Wednesday. In doing so, the pair steps back from the highest since July 01 while respecting 50-day SMA as the key resistance.
Considering the pair’s repeated failures to cross the key SMA since June 23, the quote is likely to revisit multi-day-old horizontal support near 75.00. Though, its further downside could be challenged by RSI and MACD conditions.
If at all the quote remains weak past-75.00, the monthly bottom near 74.52 and a late-March low of 74.40 could challenge the sellers ahead of highlighting 74.00 on their radars.
Meanwhile, the pair’s successful break above 50-day SMA level of 75.55 will have to clear 75.80 resistance to aim for the May-end peak near 76.10.
Even so, the bulls won’t have a proper grip over the USD/INR pair as a falling trend line from April 06, at 76.19 now, stands tall to challenge the further upside.
USD/INR daily chart
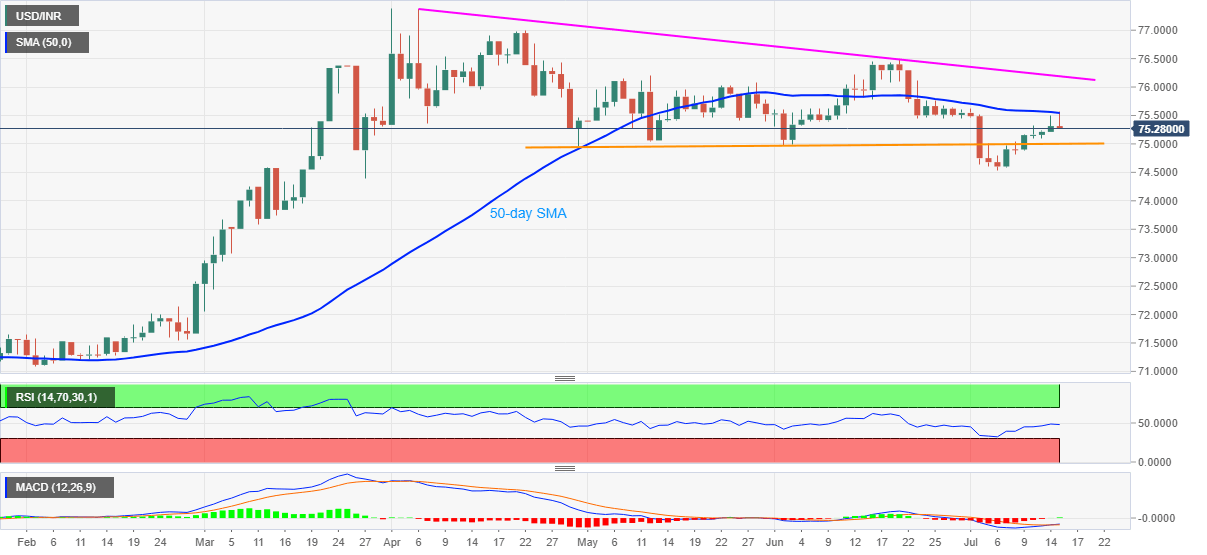
Trend: Pullback expected
Information on these pages contains forward-looking statements that involve risks and uncertainties. Markets and instruments profiled on this page are for informational purposes only and should not in any way come across as a recommendation to buy or sell in these assets. You should do your own thorough research before making any investment decisions. FXStreet does not in any way guarantee that this information is free from mistakes, errors, or material misstatements. It also does not guarantee that this information is of a timely nature. Investing in Open Markets involves a great deal of risk, including the loss of all or a portion of your investment, as well as emotional distress. All risks, losses and costs associated with investing, including total loss of principal, are your responsibility. The views and opinions expressed in this article are those of the authors and do not necessarily reflect the official policy or position of FXStreet nor its advertisers. The author will not be held responsible for information that is found at the end of links posted on this page.
If not otherwise explicitly mentioned in the body of the article, at the time of writing, the author has no position in any stock mentioned in this article and no business relationship with any company mentioned. The author has not received compensation for writing this article, other than from FXStreet.
FXStreet and the author do not provide personalized recommendations. The author makes no representations as to the accuracy, completeness, or suitability of this information. FXStreet and the author will not be liable for any errors, omissions or any losses, injuries or damages arising from this information and its display or use. Errors and omissions excepted.
The author and FXStreet are not registered investment advisors and nothing in this article is intended to be investment advice.
Recommended content
Editors’ Picks
AUD/USD hovers around 0.6500 amid light trading, ahead of US GDP

AUD/USD is trading close to 0.6500 in Asian trading on Thursday, lacking a clear directional impetus amid an Anzac Day holiday in Australia. Meanwhile, traders stay cautious due ti risk-aversion and ahead of the key US Q1 GDP release.
USD/JPY finds its highest bids since 1990, near 155.50

USD/JPY keeps breaking into its highest chart territory since June of 1990 early Thursday, testing 155.50 for the first time in 34 years as the Japanese Yen remains vulnerable, despite looming Japanese intervention risks. Focus shifts to Thursday's US GDP report and the BoJ decision on Friday.
Gold price lacks firm intraday direction, holds steady above $2,300 ahead of US data

Gold price remains confined in a narrow band for the second straight day on Thursday. Reduced Fed rate cut bets and a positive risk tone cap the upside for the commodity. Traders now await key US macro data before positioning for the near-term trajectory.
Injective price weakness persists despite over 5.9 million INJ tokens burned
Injective price is trading with a bearish bias, stuck in the lower section of the market range. The bearish outlook abounds despite the network's deflationary efforts to pump the price. Coupled with broader market gloom, INJ token’s doomed days may not be over yet.
Meta Platforms Earnings: META sinks 10% on lower Q2 revenue guidance Premium

This must be "opposites" week. While Doppelganger Tesla rode horrible misses on Tuesday to a double-digit rally, Meta Platforms produced impressive beats above Wall Street consensus after the close on Wednesday, only to watch the share price collapse by nearly 10%.