- USD/INR eases from intraday high but stays above 13-day low flashed on Thursday.
- RBI hesitates direct intervention, CE estimates Indian activity reaching pre-pandemic levels.
- Bullish candlestick helps buyers to regain previous support, back further upside.
USD/INR eases from intraday top to 74.48, printing 0.13% gains on a day, amid early Friday’s trading.
In doing so, the Indian rupee (INR) pair extends the previous day’s recovery moves, backed by bullish candlestick formation and covid fears, as well as mixed factors, at home.
India bucks the latest trend of higher covid-led deaths by marking a 483 figure versus the previous day’s 507. That said, the daily infections rose by 35,342, per the Health Ministry data per Reuters. The same helps Capital Economics (CE) to say that the Indian activities are back at pre-virus levels. This also joins the cautious optimism in the broader market scenario where the US policymakers stay hopeful of availing more stimulus and push for booster vaccines to tame the pandemic.
However, the Delta covid variant fears are bigger than the immediate easing in data and push the policymakers to keep easy money on the table, even if the RBI hesitates to go all over to safeguard the INR. The same warns governments to witness another lockdown if they’re failed over jabbing and enjoy the unlocks.
It should be noted that the pre-PMI caution and hawkish expectations from next week’s Fed meeting propel the USD/INR prices.
Read: US Markit PMIs Preview: Pre-weekend dollar boost? Downbeat figures could exacerbate risk-off mood
Technical analysis
USD/INR reverses the early-week drop to a multi-day low, re-gaining the support line broke the previous day.
Sturdy Momentum line, dragonfly Doji on the daily (D1) formation direct buyers towards the 75.00 threshold, before highlighting the yearly top surrounding 75.65.
Though, 74.90 can offer an intermediate halt, also test the USD/INR bulls.
Meanwhile, the recent bottom around 74.30 and the late June’s low close to the 74.00 round figure could restrict the short-term USD/INR downside.
Following that, the pair’s slump to the early June’s top near 73.30 can’t be ruled out.
USD/INR: Daily chart
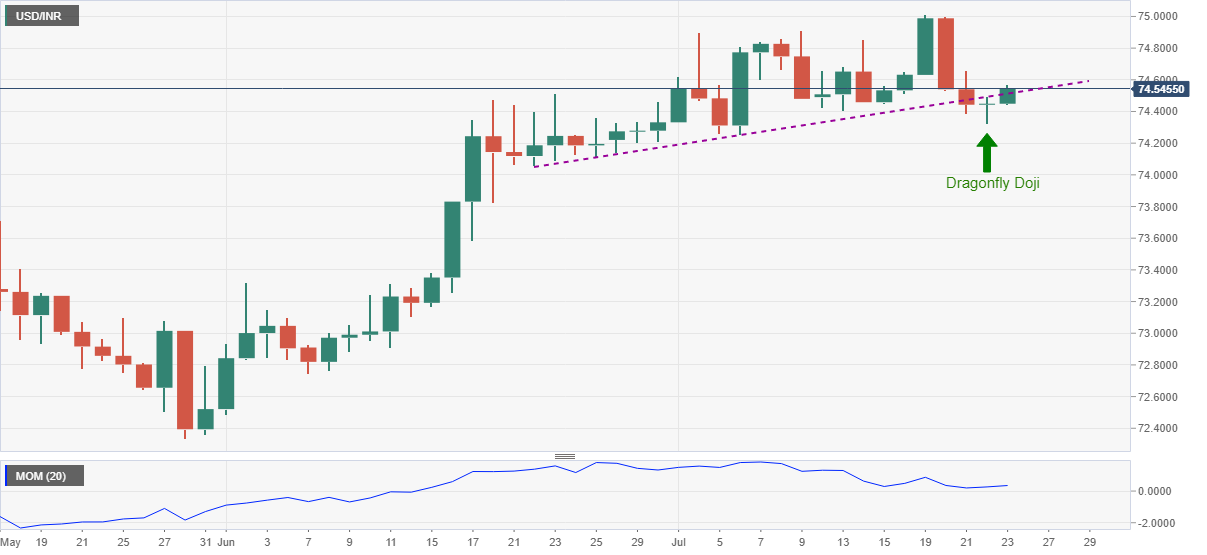
Trend: Bullish
Information on these pages contains forward-looking statements that involve risks and uncertainties. Markets and instruments profiled on this page are for informational purposes only and should not in any way come across as a recommendation to buy or sell in these assets. You should do your own thorough research before making any investment decisions. FXStreet does not in any way guarantee that this information is free from mistakes, errors, or material misstatements. It also does not guarantee that this information is of a timely nature. Investing in Open Markets involves a great deal of risk, including the loss of all or a portion of your investment, as well as emotional distress. All risks, losses and costs associated with investing, including total loss of principal, are your responsibility. The views and opinions expressed in this article are those of the authors and do not necessarily reflect the official policy or position of FXStreet nor its advertisers. The author will not be held responsible for information that is found at the end of links posted on this page.
If not otherwise explicitly mentioned in the body of the article, at the time of writing, the author has no position in any stock mentioned in this article and no business relationship with any company mentioned. The author has not received compensation for writing this article, other than from FXStreet.
FXStreet and the author do not provide personalized recommendations. The author makes no representations as to the accuracy, completeness, or suitability of this information. FXStreet and the author will not be liable for any errors, omissions or any losses, injuries or damages arising from this information and its display or use. Errors and omissions excepted.
The author and FXStreet are not registered investment advisors and nothing in this article is intended to be investment advice.
Recommended content
Editors’ Picks
AUD/USD remained bid above 0.6500

AUD/USD extended further its bullish performance, advancing for the fourth session in a row on Thursday, although a sustainable breakout of the key 200-day SMA at 0.6526 still remain elusive.
EUR/USD faces a minor resistance near at 1.0750

EUR/USD quickly left behind Wednesday’s small downtick and resumed its uptrend north of 1.0700 the figure, always on the back of the persistent sell-off in the US Dollar ahead of key PCE data on Friday.
Gold holds around $2,330 after dismal US data

Gold fell below $2,320 in the early American session as US yields shot higher after the data showed a significant increase in the US GDP price deflator in Q1. With safe-haven flows dominating the markets, however, XAU/USD reversed its direction and rose above $2,340.
Bitcoin price continues to get rejected from $65K resistance as SEC delays decision on spot BTC ETF options

Bitcoin (BTC) price has markets in disarray, provoking a broader market crash as it slumped to the $62,000 range on Thursday. Meanwhile, reverberations from spot BTC exchange-traded funds (ETFs) continue to influence the market.
US economy: slower growth with stronger inflation

The dollar strengthened, and stocks fell after statistical data from the US. The focus was on the preliminary estimate of GDP for the first quarter. Annualised quarterly growth came in at just 1.6%, down from the 2.5% and 3.4% previously forecast.