- USD/INR remains mildly positive despite the latest pullback.
- 100-day EMA, the bearish formation’s support becomes the tough nut to crack for sellers.
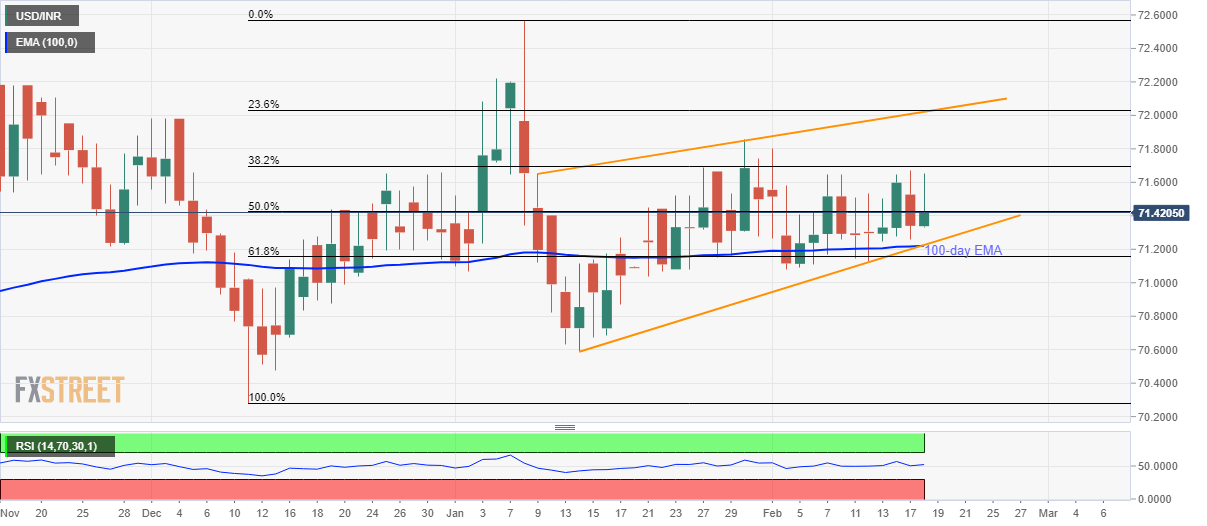
- The pattern’s resistance line, 23.6% Fibonacci retracement offers the key upside barriers.
USD/INR registers minor gains of around 0.13% while taking the bids to 71.43 amid the initial Indian session on Tuesday. The pair portrays a bearish technical pattern on the daily chart.
With the pair’s repeated failures to take-out 38.2% Fibonacci retracement of its December 11, 2019, to January 08, 2020 upside, odds are high for its gradual declines to 71.22/20 support confluence including 100-day EMA and the bearish formation’ support.
However, the pair’s declines below 71.20 on a daily closing basis will trigger a fresh downside to the yearly bottom surrounding 70.60 and then to December month lows near 70.30.
Meanwhile, an upside clearance of 38.2% Fibonacci retracement, at 71.70, could push the pair towards the 72.00 resistance confluence including the pattern’s resistance and 23.6% Fibonacci retracement.
It’s worth mentioning that the pair’s ability to cross 72.00 defies the downside favoring pattern and will push the quote towards January month top close to 72.60.
USD/INR daily chart
Trend: Pullback expected
Information on these pages contains forward-looking statements that involve risks and uncertainties. Markets and instruments profiled on this page are for informational purposes only and should not in any way come across as a recommendation to buy or sell in these assets. You should do your own thorough research before making any investment decisions. FXStreet does not in any way guarantee that this information is free from mistakes, errors, or material misstatements. It also does not guarantee that this information is of a timely nature. Investing in Open Markets involves a great deal of risk, including the loss of all or a portion of your investment, as well as emotional distress. All risks, losses and costs associated with investing, including total loss of principal, are your responsibility. The views and opinions expressed in this article are those of the authors and do not necessarily reflect the official policy or position of FXStreet nor its advertisers. The author will not be held responsible for information that is found at the end of links posted on this page.
If not otherwise explicitly mentioned in the body of the article, at the time of writing, the author has no position in any stock mentioned in this article and no business relationship with any company mentioned. The author has not received compensation for writing this article, other than from FXStreet.
FXStreet and the author do not provide personalized recommendations. The author makes no representations as to the accuracy, completeness, or suitability of this information. FXStreet and the author will not be liable for any errors, omissions or any losses, injuries or damages arising from this information and its display or use. Errors and omissions excepted.
The author and FXStreet are not registered investment advisors and nothing in this article is intended to be investment advice.
Recommended content
Editors’ Picks
AUD/USD keeps the red below 0.6400 as Middle East war fears mount

AUD/USD is keeping heavy losses below 0.6400, as risk-aversion persists following the news that Israel retaliated with missile strikes on a site in Iran. Fears of the Israel-Iran strife translating into a wider regional conflict are weighing on the higher-yielding Aussie Dollar.
USD/JPY recovers above 154.00 despite Israel-Iran escalation

USD/JPY is recovering ground above 154.00 after falling hard on confirmation of reports of an Israeli missile strike on Iran, implying that an open conflict is underway and could only spread into a wider Middle East war. Safe-haven Japanese Yen jumped, helped by BoJ Governor Ueda's comments.
Gold price pares gains below $2,400, geopolitical risks lend support

Gold price is paring gains to trade back below $2,400 early Friday, Iran's downplaying of Israel's attack has paused the Gold price rally but the upside remains supported amid mounting fears over a potential wider Middle East regional conflict.
WTI surges to $85.00 amid Israel-Iran tensions

Western Texas Intermediate, the US crude oil benchmark, is trading around $85.00 on Friday. The black gold gains traction on the day amid the escalating tension between Israel and Iran after a US official confirmed that Israeli missiles had hit a site in Iran.
Dogwifhat price pumps 5% ahead of possible Coinbase effect

Dogwifhat price recorded an uptick on Thursday, going as far as to outperform its peers in the meme coins space. Second only to Bonk Inu, WIF token’s show of strength was not just influenced by Bitcoin price reclaiming above $63,000.