- Overbought RSI conditions trigger USD/IDR pullback to short-term support-line.
- 200-bar SMA, 38.2% Fibonacci retracement limit further declines.
- 61.8% Fibonacci retracement, late-August tops on the buyers’ radar.
Despite witnessing pullback, the USD/IDR pair remains above a three-week-old rising trend-line while taking rounds to 14,210 during early Wednesday.
Even if the pair slips below immediate support-line, at 14,200, a confluence of 200-bar simple moving average (SMA) and 38.2% Fibonacci retracement of August-September declines, around 14,153/50 can challenge sellers.
Should bears dominate past-14,150, 14,000 round-figure and September month low near to 13,880 will be on their watch-list.
In a case where bulls refrain from respecting the overbought condition of 14-bar relative strength index (RSI), 61.8% Fibonacci retracement level close to 14,315 and late-August highs surrounding 14,350/60 could flash on their radars.
USD/IDR daily chart
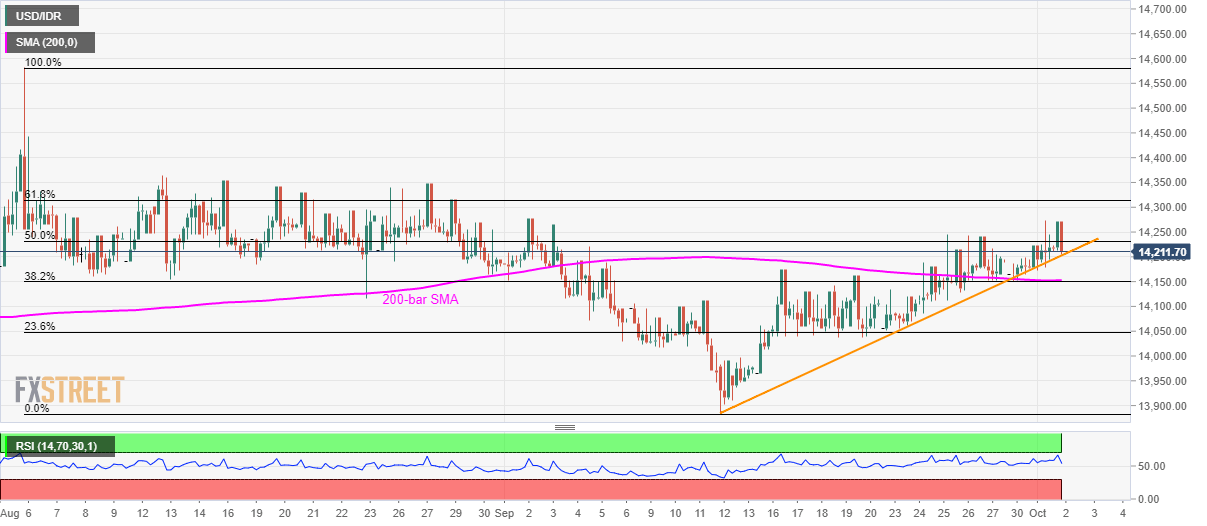
Trend: bullish
Information on these pages contains forward-looking statements that involve risks and uncertainties. Markets and instruments profiled on this page are for informational purposes only and should not in any way come across as a recommendation to buy or sell in these assets. You should do your own thorough research before making any investment decisions. FXStreet does not in any way guarantee that this information is free from mistakes, errors, or material misstatements. It also does not guarantee that this information is of a timely nature. Investing in Open Markets involves a great deal of risk, including the loss of all or a portion of your investment, as well as emotional distress. All risks, losses and costs associated with investing, including total loss of principal, are your responsibility. The views and opinions expressed in this article are those of the authors and do not necessarily reflect the official policy or position of FXStreet nor its advertisers. The author will not be held responsible for information that is found at the end of links posted on this page.
If not otherwise explicitly mentioned in the body of the article, at the time of writing, the author has no position in any stock mentioned in this article and no business relationship with any company mentioned. The author has not received compensation for writing this article, other than from FXStreet.
FXStreet and the author do not provide personalized recommendations. The author makes no representations as to the accuracy, completeness, or suitability of this information. FXStreet and the author will not be liable for any errors, omissions or any losses, injuries or damages arising from this information and its display or use. Errors and omissions excepted.
The author and FXStreet are not registered investment advisors and nothing in this article is intended to be investment advice.
Recommended content
Editors’ Picks
EUR/USD clings to daily gains above 1.0650

EUR/USD gained traction and turned positive on the day above 1.0650. The improvement seen in risk mood following the earlier flight to safety weighs on the US Dollar ahead of the weekend and helps the pair push higher.
GBP/USD recovers toward 1.2450 after UK Retail Sales data

GBP/USD reversed its direction and advanced to the 1.2450 area after touching a fresh multi-month low below 1.2400 in the Asian session. The positive shift seen in risk mood on easing fears over a deepening Iran-Israel conflict supports the pair.
Gold price defends gains below $2,400 as geopolitical risks linger

Gold price is trading below $2,400 in European trading on Friday, holding its retreat from a fresh five-day high of $2,418. Despite the pullback, Gold price remains on track to book the fifth weekly gain in a row, supported by lingering Middle East geopolitical risks.
Bitcoin Weekly Forecast: BTC post-halving rally could be partially priced in Premium

Bitcoin price shows no signs of directional bias while it holds above $60,000. The fourth BTC halving is partially priced in, according to Deutsche Bank’s research.
Geopolitics once again take centre stage, as UK Retail Sales wither

Nearly a week to the day when Iran sent drones and missiles into Israel, Israel has retaliated and sent a missile into Iran. The initial reports caused a large uptick in the oil price.