- USD/IDR keeps bounces off 200-day SMA, nears one week high of 14,795 flashed recently.
- BI is likely to keep 7-day reverse repo at 4.0% for the fourth consecutive time.
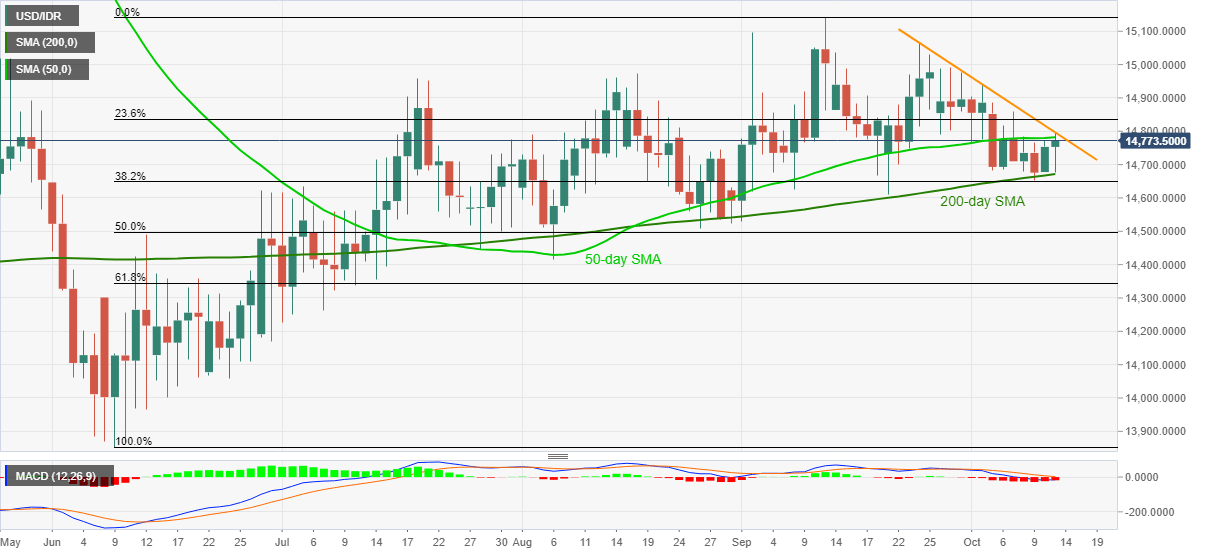
- 13-day-old resistance line joins 50-day SMA to challenge the bulls.
- The key Fibonacci retracements can lure sellers below 200-day SMA.
USD/IDR eases from the intraday high, also the weekly top, near 14,795 to 17,773, up 0.14% on a day, during Tuesday’s Asian session. The pair eyes Bank Indonesia’s (BI) October month rate decision while attacking 50-day SMA and a falling trend line from September 24.
The BI isn’t expected to alter the current monetary policy while holding the benchmark rate at 4.0%, unchanged since July irrespective of the recently downbeat economics at home.
The expected move, actually inaction, can take clues from the bearish MACD to fetch the quote back to the 200-day SMA support level of 14,671.
However, 50% and 61.8% Fibonacci retracement of the pair’s June-September rise, respectively around 14,496 and 14,345, will challenge the USD/IDR bears afterward.
On the flip side, any surprises from the BI can propel the quote to break the 14,800 immediate resistance while aiming at the monthly high of 14,940.
It should additionally be noted that the USD/IDR bulls may target the September 24 high near 15,065 and the monthly high of September, at 15,140, during the additional rise past-14,940.
USD/IDR daily chart
Trend: Pullback expected
Information on these pages contains forward-looking statements that involve risks and uncertainties. Markets and instruments profiled on this page are for informational purposes only and should not in any way come across as a recommendation to buy or sell in these assets. You should do your own thorough research before making any investment decisions. FXStreet does not in any way guarantee that this information is free from mistakes, errors, or material misstatements. It also does not guarantee that this information is of a timely nature. Investing in Open Markets involves a great deal of risk, including the loss of all or a portion of your investment, as well as emotional distress. All risks, losses and costs associated with investing, including total loss of principal, are your responsibility. The views and opinions expressed in this article are those of the authors and do not necessarily reflect the official policy or position of FXStreet nor its advertisers. The author will not be held responsible for information that is found at the end of links posted on this page.
If not otherwise explicitly mentioned in the body of the article, at the time of writing, the author has no position in any stock mentioned in this article and no business relationship with any company mentioned. The author has not received compensation for writing this article, other than from FXStreet.
FXStreet and the author do not provide personalized recommendations. The author makes no representations as to the accuracy, completeness, or suitability of this information. FXStreet and the author will not be liable for any errors, omissions or any losses, injuries or damages arising from this information and its display or use. Errors and omissions excepted.
The author and FXStreet are not registered investment advisors and nothing in this article is intended to be investment advice.
Recommended content
Editors’ Picks
EUR/USD holds gains above 1.0700, as key US data loom

EUR/USD holds gains above 1.0700 in the European session on Thursday. Renewed US Dollar weakness offsets the risk-off market environment, supporting the pair ahead of the key US GDP and PCE inflation data.
GBP/USD extends recovery above 1.2500, awaits US GDP data

GBP/USD is catching a fresh bid wave, rising above 1.2500 in European trading on Thursday. The US Dollar resumes its corrective downside, as traders resort to repositioning ahead of the high-impact US advance GDP data for the first quarter.
Gold price edges higher amid weaker USD and softer risk tone, focus remains on US GDP

Gold price (XAU/USD) attracts some dip-buying in the vicinity of the $2,300 mark on Thursday and for now, seems to have snapped a three-day losing streak, though the upside potential seems limited.
XRP extends its decline, crypto experts comment on Ripple stablecoin and benefits for XRP Ledger

Ripple extends decline to $0.52 on Thursday, wipes out weekly gains. Crypto expert asks Ripple CTO how the stablecoin will benefit the XRP Ledger and native token XRP.
US Q1 GDP Preview: Economic growth set to remain firm in, albeit easing from Q4

The United States Gross Domestic Product (GDP) is seen expanding at an annualized rate of 2.5% in Q1. The current resilience of the US economy bolsters the case for a soft landing.