- USD/CHF takes the bids to refresh intraday high, extends Friday’s rebound from monthly low.
- 50-DMA, 61.8% Fibonacci retracement level add to the downside filters, 10-DMA guards recovery moves.
- Swiss GDP, full markets eyed for fresh impulse, recovery remains elusive until staying below 0.9750.
USD/CHF pierces the 0.9600 threshold as it stretches the recovery from a one-month low following a bullish candlestick formation. That said, the Swiss currency (CHF) pair refreshed its intraday high around 0.9610 while posting the biggest daily gains in 13 days by the press time.
Not only Monday’s Doji candlestick but the 50-DMA level surrounding 0.9580 and a rebound in the RSI (14) also underpins the USD/CHF recovery.
However, 50% Fibonacci retracement of the March-May upside and the 10-DMA, respectively near 0.9630 and 0.9660, limit the short-term rebound of the USD/CHF pair.
Also acting as an upside hurdle is the area surrounding 0.9650 comprising the multiple levels marked since early May.
Meanwhile, pullback moves may initially aim for the 50-DMA level near 0.9580 before trying to reject the Doji-impressed bullish bias, by renewing the monthly low under 0.9545.
In doing so, the 61.8% Fibonacci retracement level of 0.9525 and the 0.9500 round figure may gain the market’s attention ahead of the 100-DMA, at 0.9410 by the press time.
Also read: USD/CHF rebounds from 0.9560 ahead of Swiss GDP, US NFP in focus
USD/CHF: Daily chart
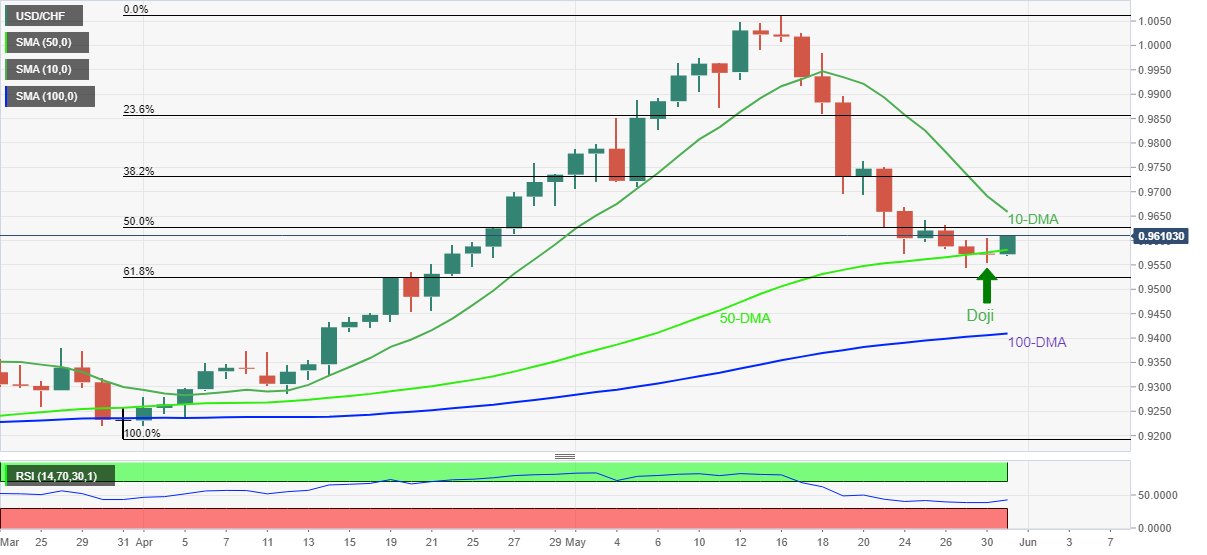
Trend: Bullish
Information on these pages contains forward-looking statements that involve risks and uncertainties. Markets and instruments profiled on this page are for informational purposes only and should not in any way come across as a recommendation to buy or sell in these assets. You should do your own thorough research before making any investment decisions. FXStreet does not in any way guarantee that this information is free from mistakes, errors, or material misstatements. It also does not guarantee that this information is of a timely nature. Investing in Open Markets involves a great deal of risk, including the loss of all or a portion of your investment, as well as emotional distress. All risks, losses and costs associated with investing, including total loss of principal, are your responsibility. The views and opinions expressed in this article are those of the authors and do not necessarily reflect the official policy or position of FXStreet nor its advertisers. The author will not be held responsible for information that is found at the end of links posted on this page.
If not otherwise explicitly mentioned in the body of the article, at the time of writing, the author has no position in any stock mentioned in this article and no business relationship with any company mentioned. The author has not received compensation for writing this article, other than from FXStreet.
FXStreet and the author do not provide personalized recommendations. The author makes no representations as to the accuracy, completeness, or suitability of this information. FXStreet and the author will not be liable for any errors, omissions or any losses, injuries or damages arising from this information and its display or use. Errors and omissions excepted.
The author and FXStreet are not registered investment advisors and nothing in this article is intended to be investment advice.
Recommended content
Editors’ Picks
EUR/USD regains traction, recovers above 1.0700

EUR/USD regained its traction and turned positive on the day above 1.0700 in the American session. The US Dollar struggles to preserve its strength after the data from the US showed that the economy grew at a softer pace than expected in Q1.
GBP/USD returns to 1.2500 area in volatile session

GBP/USD reversed its direction and recovered to 1.2500 after falling to the 1.2450 area earlier in the day. Although markets remain risk-averse, the US Dollar struggles to find demand following the disappointing GDP data.
Gold holds around $2,330 after dismal US data

Gold fell below $2,320 in the early American session as US yields shot higher after the data showed a significant increase in the US GDP price deflator in Q1. With safe-haven flows dominating the markets, however, XAU/USD reversed its direction and rose above $2,340.
XRP extends its decline, crypto experts comment on Ripple stablecoin and benefits for XRP Ledger

Ripple extends decline to $0.52 on Thursday, wipes out weekly gains. Crypto expert asks Ripple CTO how the stablecoin will benefit the XRP Ledger and native token XRP.
After the US close, it’s the Tokyo CPI

After the US close, it’s the Tokyo CPI, a reliable indicator of the national number and then the BoJ policy announcement. Tokyo CPI ex food and energy in Japan was a rise to 2.90% in March from 2.50%.