- USD/CAD's sell-off from the 1.41 recovery highs has put crucial support back in view.
- The Commodity complex has been enjoying a respite but is now testing critical resistance in the indexes.
USD/CAD is currently trading on the bid, having travelled from a low of 1.3891 to a high of 1.3970 rising 0.41% to 1.3956 at the time of writing. The US dollar is broadly positive on the day following a resurgence overnight. DXY is 0.2% up so far and proving resilient in the 99 handle.
Commodity currencies are struggling to hold onto gains towards the end of the week as US-Sino tensions continue to heat up, sapping some appetite from risk assets. China has warned that US measures and sanctions would result in counter-measures. The Global Times wrote
China never starts trouble and never flinches when trouble comes its way. China will firmly defend its interests if the US does things that undermine China's core interest: NPC spokesperson.
However, in the balance, we have firming demand which continues to buoy the commodity complex just as global economies reopen. Ahead of China's National Party Congress, analysts at TD Securities explained that "expectations are rising that demand will increase further, should China announce further measures of economic support."
Meanwhile, with CAD correlated to the global energy markets which continue to trade strong amid rebalancing, tumbling supply and reports that demand is recovering, some stability along these daily lows vs the greenback (1.3850) might be expected for some time still to come. Like with all commodity currencies at the moment, there has also been a strong correlation to equities throughout this crisis:
S&P 500 Index meets 61.8% Fibo (the Golden Ratio)
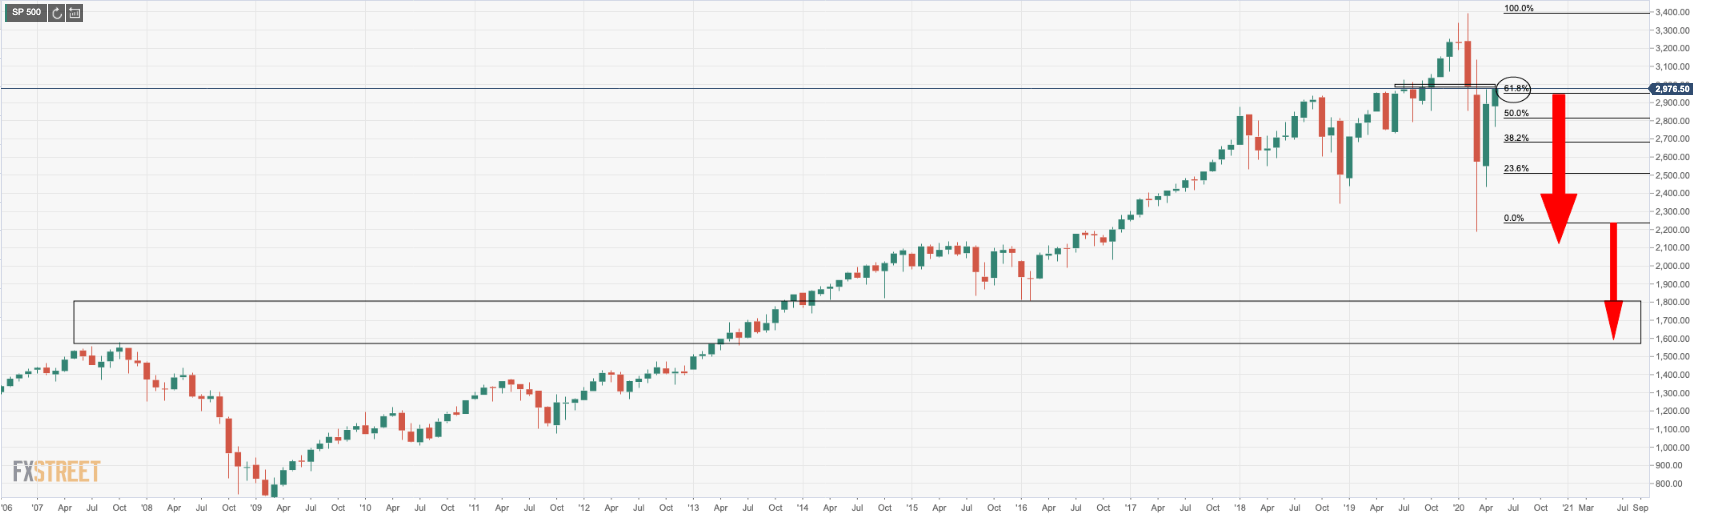
The S&P 500 has met a 61.8% Fibonacci retracement around the 2950s which is garnering a great deal of the market's attention. There are little signs that the market is about to turn south however with positive volumes on the bullish and positive closes. However, it is either make or break time on both the equities and CRB index daily charts.
Doubts about the sustainability of the recent rallies are emerging, particularly in commodities. Copper is higher for all of the wrong reasons and tightness in the copper market shows no sign of easing. Gold is underpinned by pure uncertainty, the compelling arguments which support the case for a global depression and a subsequent financial market's crash (US dollar, yen and CHF supportive as well). Economists are predicting currency debasements which will be highly unfavourable to commodity-FX.
A bullish onslaught in the making
"We rather think that a lot of good news is already in CAD's price," analysts at TD Securities argued. "Positioning is skewed short, but we think these are strategic in nature. Meanwhile, a broad USD pullback appears well advanced on our measure."
Catalysts for a bullish onslaught will be pertaining to the spread of COVID-19 and nowhere for stocks to go, a drop in oil demand on prospects of the second wave of COVID-19 or sheer lack of a vaccine and a flare-up in trade tensions and a war of words between China and the US. All scenarios are bullish for the US dollar, at least in the near term, and continuously bad news for the commodity complex.
On the other hand, should by chance none of the above come into fruition, we can expect a break of critical support and a continued unwinding of the US dollar.
USD/CAD levels
Noting the 1.3850/70 area, the analysts at TD Securities explained that this is the third time it has been tested as part of a broader descending triangle since the March highs. "Thus, a break below this support would be bearish the pair, particularly if confirmed with DMA crossovers that would expose 1.3766. Meanwhile, a move through 1.4050/80 daily downtrend resistance will open topside extension."
Information on these pages contains forward-looking statements that involve risks and uncertainties. Markets and instruments profiled on this page are for informational purposes only and should not in any way come across as a recommendation to buy or sell in these assets. You should do your own thorough research before making any investment decisions. FXStreet does not in any way guarantee that this information is free from mistakes, errors, or material misstatements. It also does not guarantee that this information is of a timely nature. Investing in Open Markets involves a great deal of risk, including the loss of all or a portion of your investment, as well as emotional distress. All risks, losses and costs associated with investing, including total loss of principal, are your responsibility. The views and opinions expressed in this article are those of the authors and do not necessarily reflect the official policy or position of FXStreet nor its advertisers. The author will not be held responsible for information that is found at the end of links posted on this page.
If not otherwise explicitly mentioned in the body of the article, at the time of writing, the author has no position in any stock mentioned in this article and no business relationship with any company mentioned. The author has not received compensation for writing this article, other than from FXStreet.
FXStreet and the author do not provide personalized recommendations. The author makes no representations as to the accuracy, completeness, or suitability of this information. FXStreet and the author will not be liable for any errors, omissions or any losses, injuries or damages arising from this information and its display or use. Errors and omissions excepted.
The author and FXStreet are not registered investment advisors and nothing in this article is intended to be investment advice.
Recommended content
Editors’ Picks
AUD/USD posts gain, yet dive below 0.6500 amid Aussie CPI, ahead of US GDP

The Aussie Dollar finished Wednesday’s session with decent gains of 0.15% against the US Dollar, yet it retreated from weekly highs of 0.6529, which it hit after a hotter-than-expected inflation report. As the Asian session begins, the AUD/USD trades around 0.6495.
USD/JPY finds its highest bids since 1990, approaches 156.00

USD/JPY broke into its highest chart territory since June of 1990 on Wednesday, peaking near 155.40 for the first time in 34 years as the Japanese Yen continues to tumble across the broad FX market.
Gold stays firm amid higher US yields as traders await US GDP data

Gold recovers from recent losses, buoyed by market interest despite a stronger US Dollar and higher US Treasury yields. De-escalation of Middle East tensions contributed to increased market stability, denting the appetite for Gold buying.
Ethereum suffers slight pullback, Hong Kong spot ETH ETFs to begin trading on April 30

Ethereum suffered a brief decline on Wednesday afternoon despite increased accumulation from whales. This follows Ethereum restaking protocol Renzo restaked ETH crashing from its 1:1 peg with ETH and increased activities surrounding spot Ethereum ETFs.
Dow Jones Industrial Average hesitates on Wednesday as markets wait for key US data

The DJIA stumbled on Wednesday, falling from recent highs near 38,550.00 as investors ease off of Tuesday’s risk appetite. The index recovered as US data continues to vex financial markets that remain overwhelmingly focused on rate cuts from the US Fed.