- USD/CAD edged lower on Monday and eroded a part of the previous session’s strong positive to two-week tops.
- Bullish oil prices underpinned the loonie and exerted some pressure; renewed USD buying helped limit losses.
- The set-up seems tilted in favour of bullish traders and supports prospects for the emergence of some dip-buying.
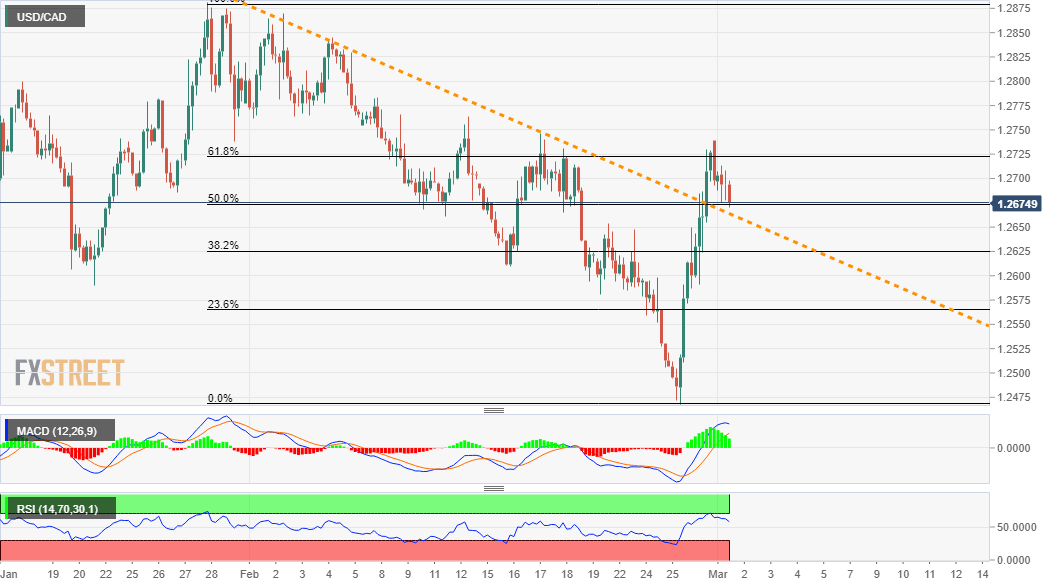
The USD/CAD pair witnessed some selling on the first day of a new trading week and eroded a part of Friday's strong positive move to two-week tops, around the 1.2745-50 supply zone. The pair was last seen trading near the lower end of its daily trading range, around the 1.2675-70 region.
A modest uptick in crude oil prices, now up around 1% for the day, underpinned the commodity-linked loonie and exerted some downward pressure. However, the emergence of some fresh US dollar buying interest extended some support and helped limit any deeper losses for the USD/CAD pair.
From a technical perspective, last week's strong rebound from multi-year tops struggled to find acceptance above the 61.8% Fibonacci level of the 1.2882-1.2468 downfall. The subsequent pullback has now dragged the USD/CAD pair back to a short-term descending trend-line resistance breakpoint.
The mentioned resistance-turned support coincides with the 50% Fibo. level and should now act as a pivotal point for short-term traders. Given that oscillators on the daily chart have recovered from the bearish territory, the pullback could still be seen as a buying opportunity.
That said, a convincing break below mid-1.2600s will negate the positive outlook and turn the USD/CAD pair vulnerable to resume its prior/well-established downtrend. The pair might then accelerate the fall towards 38.2% Fibo. level, around the 1.2625 region en-route the 1.2600 mark.
On the flip side, the 1.2700 round-figure mark now seems to act as immediate resistance. This is followed by the 61.8% Fibo. and the 1.2745-50 hurdle. A sustained strength beyond will be seen as a fresh trigger for bullish traders and pave the way for further near-term gains.
The USD/CAD pair might then aim to surpass the 1.2800 round-figure mark and head towards the next major resistance near the 1.2865-85 region tested in January.
USD/CAD 4-hourly chart
Technical levels to watch
Information on these pages contains forward-looking statements that involve risks and uncertainties. Markets and instruments profiled on this page are for informational purposes only and should not in any way come across as a recommendation to buy or sell in these assets. You should do your own thorough research before making any investment decisions. FXStreet does not in any way guarantee that this information is free from mistakes, errors, or material misstatements. It also does not guarantee that this information is of a timely nature. Investing in Open Markets involves a great deal of risk, including the loss of all or a portion of your investment, as well as emotional distress. All risks, losses and costs associated with investing, including total loss of principal, are your responsibility. The views and opinions expressed in this article are those of the authors and do not necessarily reflect the official policy or position of FXStreet nor its advertisers. The author will not be held responsible for information that is found at the end of links posted on this page.
If not otherwise explicitly mentioned in the body of the article, at the time of writing, the author has no position in any stock mentioned in this article and no business relationship with any company mentioned. The author has not received compensation for writing this article, other than from FXStreet.
FXStreet and the author do not provide personalized recommendations. The author makes no representations as to the accuracy, completeness, or suitability of this information. FXStreet and the author will not be liable for any errors, omissions or any losses, injuries or damages arising from this information and its display or use. Errors and omissions excepted.
The author and FXStreet are not registered investment advisors and nothing in this article is intended to be investment advice.
Recommended content
Editors’ Picks
AUD/USD hovers around 0.6500 amid light trading, ahead of US GDP

AUD/USD is trading close to 0.6500 in Asian trading on Thursday, lacking a clear directional impetus amid an Anzac Day holiday in Australia. Meanwhile, traders stay cautious due ti risk-aversion and ahead of the key US Q1 GDP release.
USD/JPY finds its highest bids since 1990, near 155.50

USD/JPY keeps breaking into its highest chart territory since June of 1990 early Thursday, testing 155.50 for the first time in 34 years as the Japanese Yen remains vulnerable, despite looming Japanese intervention risks. Focus shifts to Thursday's US GDP report and the BoJ decision on Friday.
Gold price treads water near $2,320, awaits US GDP data

Gold price recovers losses but keeps its range near $2,320 early Thursday. Renewed weakness in the US Dollar and the US Treasury yields allow Gold buyers to breathe a sigh of relief. Gold price stays vulnerable amid Middle East de-escalation, awaiting US Q1 GDP data.
Injective price weakness persists despite over 5.9 million INJ tokens burned
Injective price is trading with a bearish bias, stuck in the lower section of the market range. The bearish outlook abounds despite the network's deflationary efforts to pump the price. Coupled with broader market gloom, INJ token’s doomed days may not be over yet.
Meta Platforms Earnings: META sinks 10% on lower Q2 revenue guidance Premium

This must be "opposites" week. While Doppelganger Tesla rode horrible misses on Tuesday to a double-digit rally, Meta Platforms produced impressive beats above Wall Street consensus after the close on Wednesday, only to watch the share price collapse by nearly 10%.