- USD/CAD moves into the positive territory for the third consecutive session on Thursday.
- The set-up supports prospects for an eventual break through a descending trend channel.
The USD/CAD pair quickly reversed an early European session dip to sub-1.2600 levels and turned positive for the third consecutive session. The pair jumped back closer to over one-week tops set in the previous session, though lacked any follow-through buying.
A softer tone around crude oil prices undermined the commodity-linked loonie and extended some support to the USD/CAD pair. That said, the emergence of some fresh US dollar selling held bulls from placing aggressive bets and capped the upside, at least for the time being.
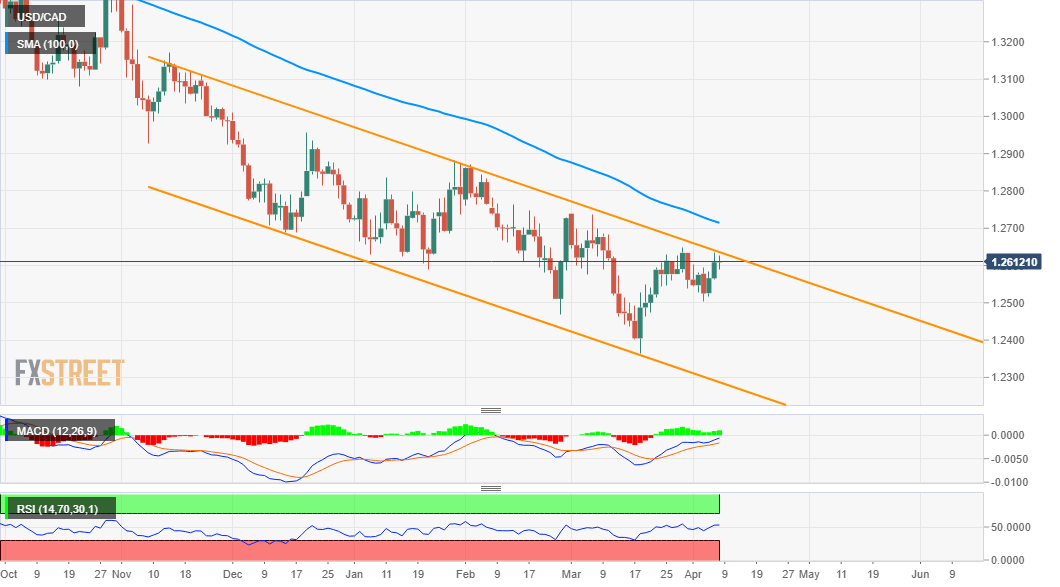
Looking at the technical picture, the USD/CAD pair, so far, has been struggling to find acceptance above the 1.2625-30 region. The mentioned area coincides with the top boundary of a four-month-old descending channel, which should now act as a key pivotal point.
Meanwhile, technical indicators on hourly charts have been gaining positive traction and just started moving into the bullish territory on the daily chart. The set-up supports prospects for an eventual bullish breakout through the trend-channel and additional gains.
A sustained move beyond might trigger a short-covering move and assist the USD/CAD pair to aim back to reclaim the 1.2700 mark for the first time since March 8. The momentum could further get extended towards the next relevant hurdle near the 1.2740-50 supply zone.
On the flip side, any meaningful pullback should continue to attract some dip-buying and remain limited near the 1.2600-1.2590 region. Some follow-through weakness below the 1.2575-70 region might turn the USD/CAD pair vulnerable to retest the key 1.2500 psychological mark.
USD/CAD daily chart
Technical levels to watch
Information on these pages contains forward-looking statements that involve risks and uncertainties. Markets and instruments profiled on this page are for informational purposes only and should not in any way come across as a recommendation to buy or sell in these assets. You should do your own thorough research before making any investment decisions. FXStreet does not in any way guarantee that this information is free from mistakes, errors, or material misstatements. It also does not guarantee that this information is of a timely nature. Investing in Open Markets involves a great deal of risk, including the loss of all or a portion of your investment, as well as emotional distress. All risks, losses and costs associated with investing, including total loss of principal, are your responsibility. The views and opinions expressed in this article are those of the authors and do not necessarily reflect the official policy or position of FXStreet nor its advertisers. The author will not be held responsible for information that is found at the end of links posted on this page.
If not otherwise explicitly mentioned in the body of the article, at the time of writing, the author has no position in any stock mentioned in this article and no business relationship with any company mentioned. The author has not received compensation for writing this article, other than from FXStreet.
FXStreet and the author do not provide personalized recommendations. The author makes no representations as to the accuracy, completeness, or suitability of this information. FXStreet and the author will not be liable for any errors, omissions or any losses, injuries or damages arising from this information and its display or use. Errors and omissions excepted.
The author and FXStreet are not registered investment advisors and nothing in this article is intended to be investment advice.
Recommended content
Editors’ Picks
AUD/USD tumbles toward 0.6350 as Middle East war fears mount

AUD/USD has come under intense selling pressure and slides toward 0.6350, as risk-aversion intensifies following the news that Israel retaliated with missile strikes on a site in Iran. Fears of the Israel-Iran strife translating into a wider regional conflict are weighing on the higher-yielding Aussie Dollar.
USD/JPY breaches 154.00 as sell-off intensifies on Israel-Iran escalation

USD/JPY is trading below 154.00 after falling hard on confirmation of reports of an Israeli missile strike on Iran, implying that an open conflict is underway and could only spread into a wider Middle East war. Safe-haven Japanese Yen jumped, helped by BoJ Governor Ueda's comments.
Gold price jumps above $2,400 as MidEast escalation sparks flight to safety

Gold price has caught a fresh bid wave, jumping beyond $2,400 after Israel's retaliatory strikes on Iran sparked a global flight to safety mode and rushed flows into the ultimate safe-haven Gold. Risk assets are taking a big hit, as risk-aversion creeps into Asian trading on Friday.
WTI surges to $85.00 amid Israel-Iran tensions

Western Texas Intermediate, the US crude oil benchmark, is trading around $85.00 on Friday. The black gold gains traction on the day amid the escalating tension between Israel and Iran after a US official confirmed that Israeli missiles had hit a site in Iran.
Dogwifhat price pumps 5% ahead of possible Coinbase effect

Dogwifhat price recorded an uptick on Thursday, going as far as to outperform its peers in the meme coins space. Second only to Bonk Inu, WIF token’s show of strength was not just influenced by Bitcoin price reclaiming above $63,000.