- USD/CAD finds support from USD rebound, WTI weakness.
- The pair sights a potential bull pennant on the 4H chart.
- 50 and 100 SMAs bullish crossover backs the upswing.
USD/CAD is holding higher ground near the mid-1.2900s, as bulls continue to capitalize on the risk-off flows-driven renewed US dollar upswing.
Meanwhile, the 1% drop in WTI prices, amid risk-aversion and a potential increase in the Russian oil output, weighs negatively on the resource-linked Canadian dollar. Therefore, USD/CAD cheers the oil price weakness heading into a bunch of the US housing and jobs data. Investors also look forward to the Canadian Wholesale Sales data for fresh trading cues.
From a short-term technical perspective, USD/CAD is poised for the additional upside as bulls have spotted a bull pennant formation on the four-hour chart, which will be confirmed on a sustained break above the falling trendline resistance at 1.2947.
On an upside break validation, the pair could advance to retest the 1.3000 supply zone, above which the 1.3050 psychological level could be tested.
The 14-day Relative Strength Index (RSI) is turning lower but holds well above the midline, supporting the case for the upside.
Adding credence to the bullish potential, a 50 and 100-Simple Moving Averages (SMA) bullish crossover, confirmed on Wednesday, remains in play.
USD/CAD: Four-hour chart
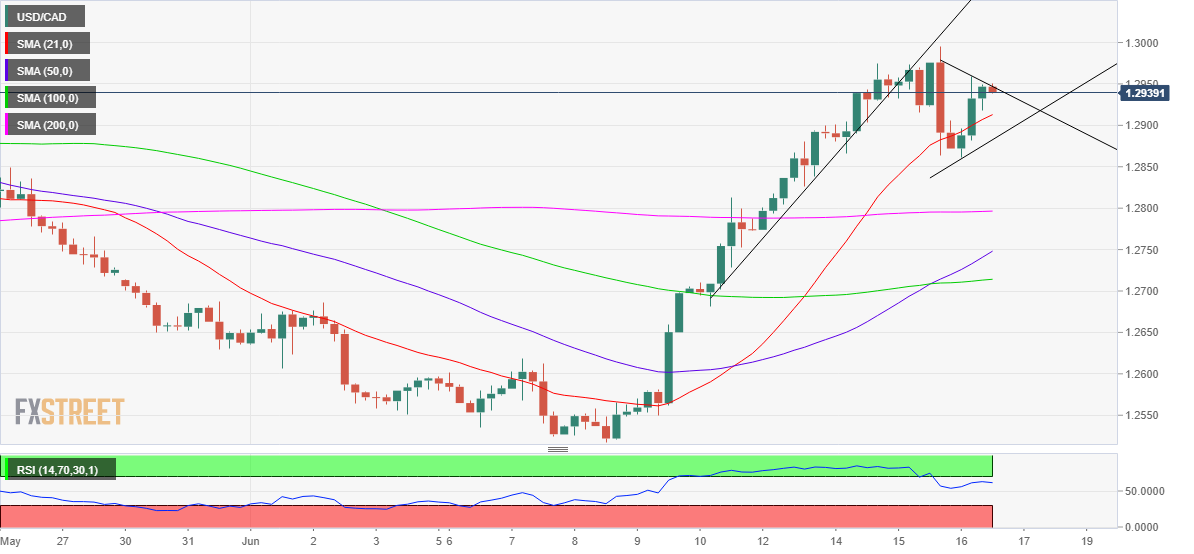
On the other side, the bullish 21 SMA at 1.2913 will limit any pullback, a break below which will open floors towards the rising trendline support at 1.2882.
A four-hourly candlestick closing below the latter will lead to the pattern failure, exposing the further downside towards the horizontal 200 SMA at 1.2796.
USD/CAD: Additional levels to consider
Information on these pages contains forward-looking statements that involve risks and uncertainties. Markets and instruments profiled on this page are for informational purposes only and should not in any way come across as a recommendation to buy or sell in these assets. You should do your own thorough research before making any investment decisions. FXStreet does not in any way guarantee that this information is free from mistakes, errors, or material misstatements. It also does not guarantee that this information is of a timely nature. Investing in Open Markets involves a great deal of risk, including the loss of all or a portion of your investment, as well as emotional distress. All risks, losses and costs associated with investing, including total loss of principal, are your responsibility. The views and opinions expressed in this article are those of the authors and do not necessarily reflect the official policy or position of FXStreet nor its advertisers. The author will not be held responsible for information that is found at the end of links posted on this page.
If not otherwise explicitly mentioned in the body of the article, at the time of writing, the author has no position in any stock mentioned in this article and no business relationship with any company mentioned. The author has not received compensation for writing this article, other than from FXStreet.
FXStreet and the author do not provide personalized recommendations. The author makes no representations as to the accuracy, completeness, or suitability of this information. FXStreet and the author will not be liable for any errors, omissions or any losses, injuries or damages arising from this information and its display or use. Errors and omissions excepted.
The author and FXStreet are not registered investment advisors and nothing in this article is intended to be investment advice.
Recommended content
Editors’ Picks
EUR/USD clings to daily gains above 1.0650

EUR/USD gained traction and turned positive on the day above 1.0650. The improvement seen in risk mood following the earlier flight to safety weighs on the US Dollar ahead of the weekend and helps the pair push higher.
GBP/USD recovers toward 1.2450 after UK Retail Sales data

GBP/USD reversed its direction and advanced to the 1.2450 area after touching a fresh multi-month low below 1.2400 in the Asian session. The positive shift seen in risk mood on easing fears over a deepening Iran-Israel conflict supports the pair.
Gold holds steady at around $2,380 following earlier spike

Gold stabilized near $2,380 after spiking above $2,400 with the immediate reaction to reports of Israel striking Iran. Meanwhile, the pullback seen in the US Treasury bond yields helps XAU/USD hold its ground.
Bitcoin Weekly Forecast: BTC post-halving rally could be partially priced in Premium

Bitcoin price shows no signs of directional bias while it holds above $60,000. The fourth BTC halving is partially priced in, according to Deutsche Bank’s research.
Week ahead – US GDP and BoJ decision on top of next week’s agenda

US GDP, core PCE and PMIs the next tests for the Dollar. Investors await BoJ for guidance about next rate hike. EU and UK PMIs, as well as Australian CPIs also on tap.