- The Dow Jones Industrial Average is down 0.17% to 35,442.5.
- The S&P 500 is just shy of a record close Wednesday. The Nasdaq rose 0.5%.
- US yields are making fresh cycle highs with more to come.
US stocks are on Thursday while government bond yields have touched a fresh five-month high after initial jobless claims fell to their latest low since the start of the pandemic.
The Dow Jones Industrial Average is down 0.17% to 35,442.53 the low on the day after setting an intraday high, while the S&P 500 added 0.18% after six straight gains that left it just shy of a record close Wednesday. The Nasdaq rose 0.5%. The S&P 500 posted 51 new 52-week highs and no new lows; the Nasdaq Composite recorded 93 new highs and 33 new lows. Consumer discretionary shares have fared best so far, while materials and energy lagged.
Seven of the 11 major S&P 500 sectors were trading lower, with energy stocks declining the most. Consumer discretionary was the biggest percentage gainer among the S&P sectors so far, with help from Amazon.com Inc. Meanwhile, analysts are expecting S&P 500 third-quarter earnings to rise 33.7% year-on-year, according to Refinitiv.
In the economic calendar, Initial jobless claims fell to 290,000 in the US during the week ended Oct. 16 from an upwardly revised 296,000 in the previous week. The four-week moving average fell by 15,250 to 319,750, a new low since the start of the COVID-19 pandemic. In other data, the US existing home sales climbed 7% in September to a seasonally adjusted annual rate of 6.29 million from 5.88 million in August, exceeding expectations for a rise to 6.1 million.
Meanwhile, market-implied expectations for US inflation for the next five years have surged to the highest in 15 years as measured by breakevens, Bloomberg reported.
US yields on Thursday have indeed moved higher on Thursday with the 10-year printing a fresh 1.682% high on the approach to the March highs of 1.774% from a technical perspective:
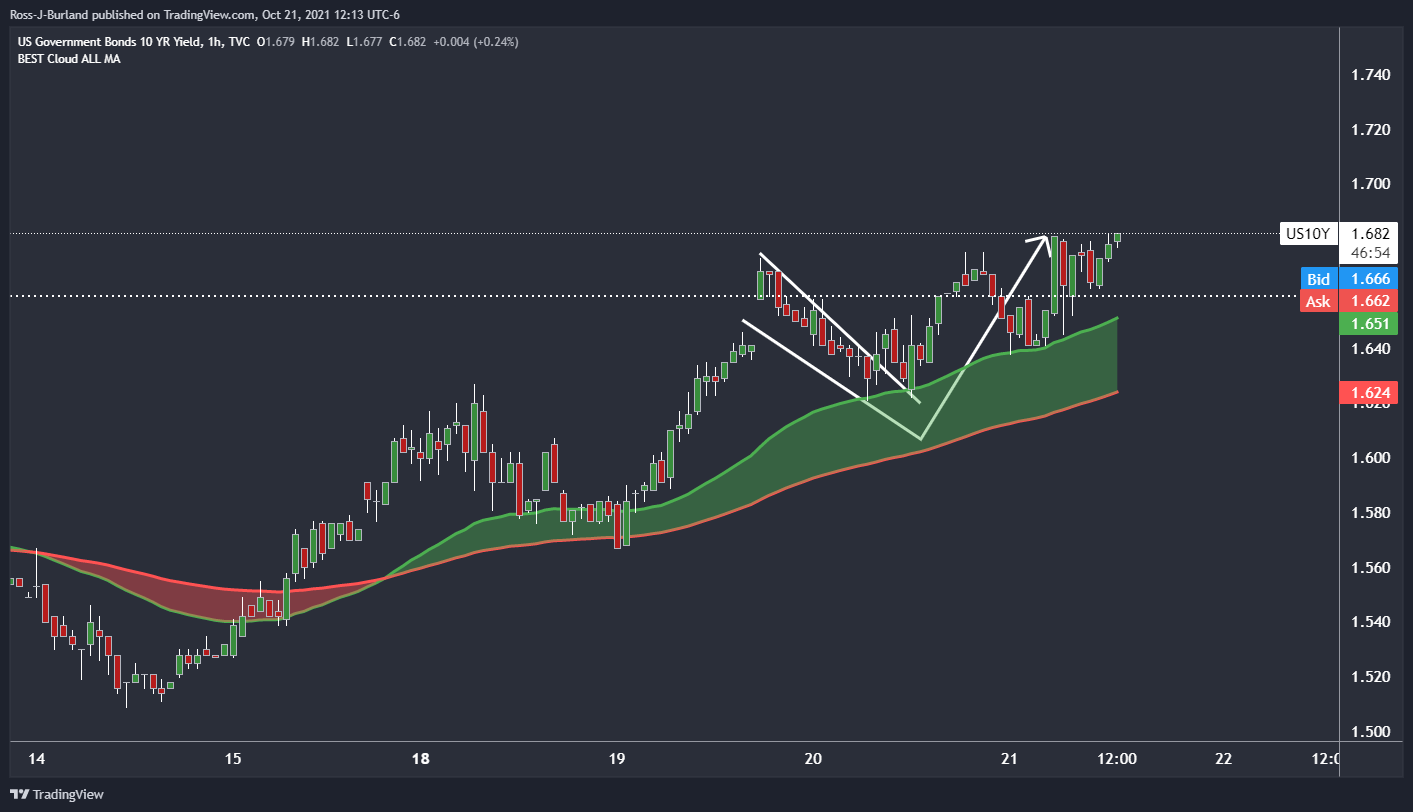
From a daily perspective, there are prospects of a move beyond the daily highs towards a -272% Fibonacci retracement of the current daily flag's range:

S&P 500 technical analysis
-637704399854184329.png)
The S&P 500 is a compelling technical picture given the counter-trendline and combination of the W-formation. Both are bearish as the counter-trendline would be expected to act as resistance on a restest and the W-formaiton is a reversion pattern. The price would be expected to test the neckline of the W-formation at 4,483 following a restest of the counter trendline.
Information on these pages contains forward-looking statements that involve risks and uncertainties. Markets and instruments profiled on this page are for informational purposes only and should not in any way come across as a recommendation to buy or sell in these assets. You should do your own thorough research before making any investment decisions. FXStreet does not in any way guarantee that this information is free from mistakes, errors, or material misstatements. It also does not guarantee that this information is of a timely nature. Investing in Open Markets involves a great deal of risk, including the loss of all or a portion of your investment, as well as emotional distress. All risks, losses and costs associated with investing, including total loss of principal, are your responsibility. The views and opinions expressed in this article are those of the authors and do not necessarily reflect the official policy or position of FXStreet nor its advertisers. The author will not be held responsible for information that is found at the end of links posted on this page.
If not otherwise explicitly mentioned in the body of the article, at the time of writing, the author has no position in any stock mentioned in this article and no business relationship with any company mentioned. The author has not received compensation for writing this article, other than from FXStreet.
FXStreet and the author do not provide personalized recommendations. The author makes no representations as to the accuracy, completeness, or suitability of this information. FXStreet and the author will not be liable for any errors, omissions or any losses, injuries or damages arising from this information and its display or use. Errors and omissions excepted.
The author and FXStreet are not registered investment advisors and nothing in this article is intended to be investment advice.
Recommended content
Editors’ Picks
AUD/USD remained bid above 0.6500

AUD/USD extended further its bullish performance, advancing for the fourth session in a row on Thursday, although a sustainable breakout of the key 200-day SMA at 0.6526 still remain elusive.
EUR/USD faces a minor resistance near at 1.0750

EUR/USD quickly left behind Wednesday’s small downtick and resumed its uptrend north of 1.0700 the figure, always on the back of the persistent sell-off in the US Dollar ahead of key PCE data on Friday.
Gold holds around $2,330 after dismal US data

Gold fell below $2,320 in the early American session as US yields shot higher after the data showed a significant increase in the US GDP price deflator in Q1. With safe-haven flows dominating the markets, however, XAU/USD reversed its direction and rose above $2,340.
Bitcoin price continues to get rejected from $65K resistance as SEC delays decision on spot BTC ETF options

Bitcoin (BTC) price has markets in disarray, provoking a broader market crash as it slumped to the $62,000 range on Thursday. Meanwhile, reverberations from spot BTC exchange-traded funds (ETFs) continue to influence the market.
US economy: slower growth with stronger inflation

The dollar strengthened, and stocks fell after statistical data from the US. The focus was on the preliminary estimate of GDP for the first quarter. Annualised quarterly growth came in at just 1.6%, down from the 2.5% and 3.4% previously forecast.