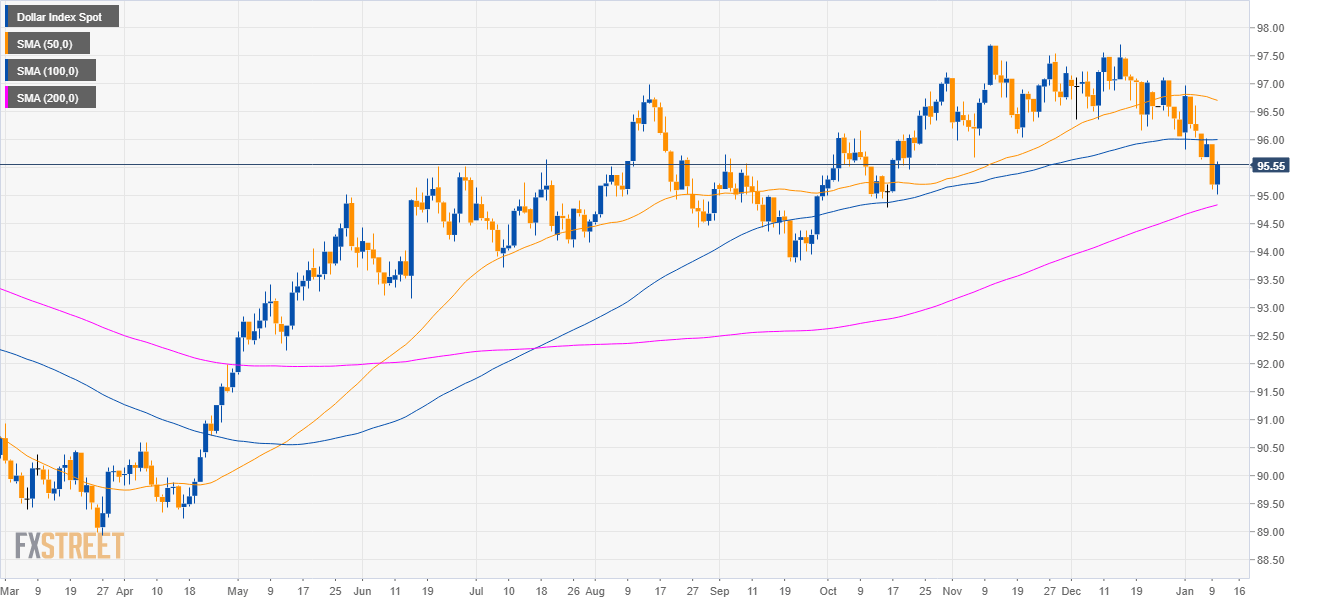
DXY daily chart
- The US Dollar Index (DXY) is trading in a bull trend above the 200-period simple moving average (SMA).
- As foreacst DXY reached the 95.60 target.
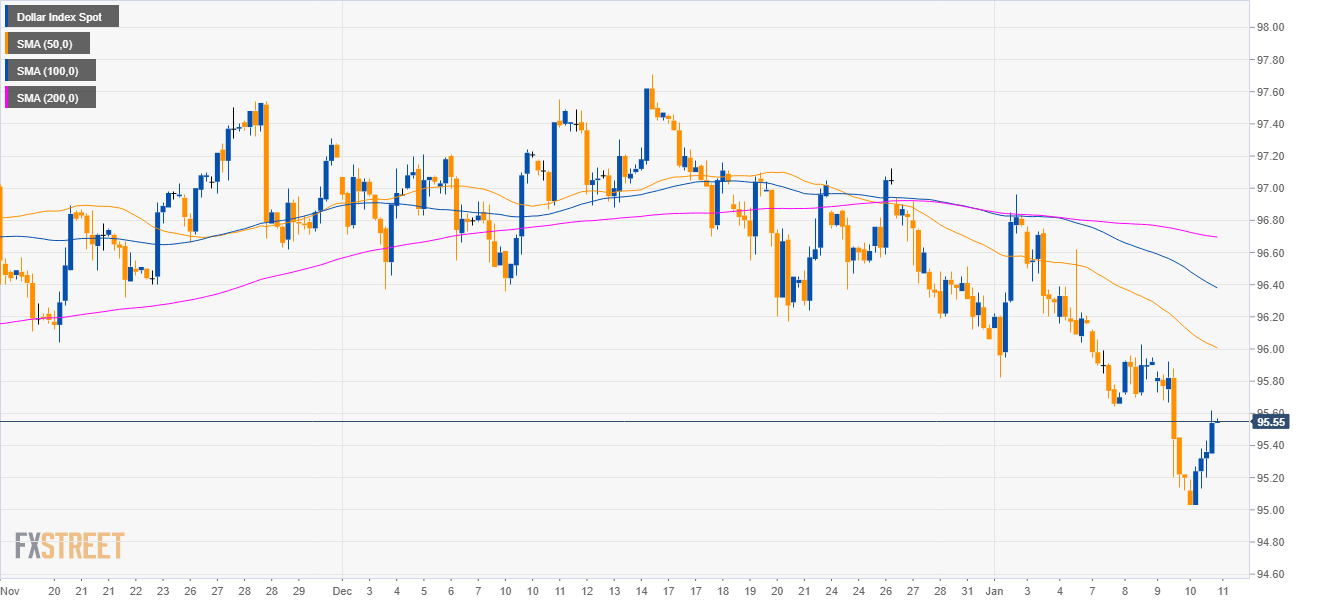
DXY 4-hour chart
- DXY is having a bullish reversal as the market is trading below its main SMAs.
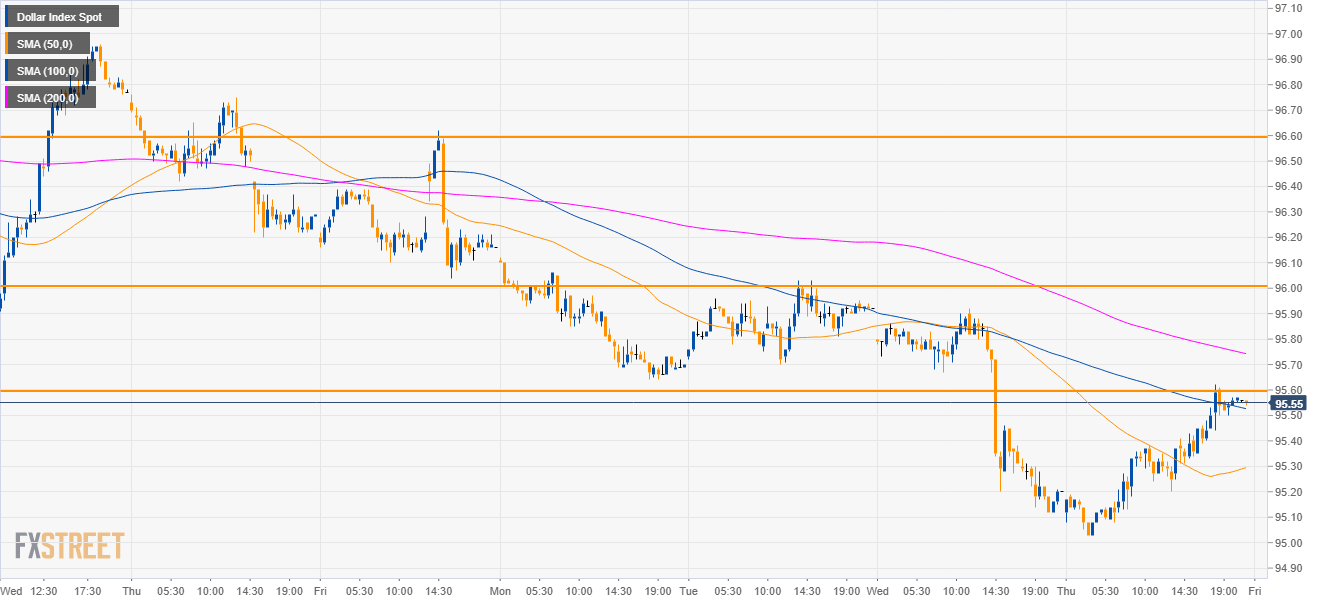
DXY 30-minute chart
- Bulls have reclaimed the 50 SMA and are currently just above the 100 SMA.
- Now that 95.60 target has been achieved, the next objective for bulls is the 96.00 figure.
Additional key levels
Dollar Index Spot
Overview:
Today Last Price: 95.55
Today Daily change: 35 pips
Today Daily change %: 0.368%
Today Daily Open: 95.2
Trends:
Previous Daily SMA20: 96.58
Previous Daily SMA50: 96.73
Previous Daily SMA100: 96
Previous Daily SMA200: 94.81
Levels:
Previous Daily High: 95.92
Previous Daily Low: 95.12
Previous Weekly High: 96.96
Previous Weekly Low: 95.82
Previous Monthly High: 97.71
Previous Monthly Low: 96.06
Previous Daily Fibonacci 38.2%: 95.43
Previous Daily Fibonacci 61.8%: 95.61
Previous Daily Pivot Point S1: 94.91
Previous Daily Pivot Point S2: 94.61
Previous Daily Pivot Point S3: 94.11
Previous Daily Pivot Point R1: 95.71
Previous Daily Pivot Point R2: 96.21
Previous Daily Pivot Point R3: 96.51
Note: All information on this page is subject to change. The use of this website constitutes acceptance of our user agreement. Please read our privacy policy and legal disclaimer. Opinions expressed at FXstreet.com are those of the individual authors and do not necessarily represent the opinion of FXstreet.com or its management. Risk Disclosure: Trading foreign exchange on margin carries a high level of risk, and may not be suitable for all investors. The high degree of leverage can work against you as well as for you. Before deciding to invest in foreign exchange you should carefully consider your investment objectives, level of experience, and risk appetite. The possibility exists that you could sustain a loss of some or all of your initial investment and therefore you should not invest money that you cannot afford to lose. You should be aware of all the risks associated with foreign exchange trading, and seek advice from an independent financial advisor if you have any doubts.
Recommended content
Editors’ Picks
EUR/USD steady near 1.0650 as markets gear up for PMI-heavy Tuesday

EUR/USD is testing the waters near 1.0650 after a quiet Monday saw the major pair flatline ahead of a densely-packed economic data docket. Both the US and the wider Eurozone area will see updates to Purchasing Managers Index (PMI) figures on Tuesday.
GBP/USD: Flat lines around mid-1.2300s, bearish potential seems intact

GBP/USD holds steady on Tuesday amid subdued USD demand, albeit lacks bullish conviction. The divergent Fed-BoE policy expectations turn out to be a key factor acting as a headwind. The technical setup suggests that the path of least resistance for the pair is to the downside.
Gold could see a rebound before resuming the correction

Gold price sees a fresh leg down in Asia on Tuesday even as risk flows dissipate. Receding fears over Middle East escalation offset subdued US Dollar and Treasury bond yields. Gold remains heavily oversold on the 4H chart, rebound appears in the offing.
PENDLE price soars 10% after Arthur Hayes’ optimism on Pendle derivative exchange

Pendle price is among the top performers in the cryptocurrency market today, posting double-digit gains. Its peers in the altcoin space are not as forthcoming even as the market enjoys bullish sentiment inspired by Bitcoin price.
After Monday's relief rally, attention shifts to earnings and policy fronts

With the easing of tensions in the Middle East, safe-haven demand reversed course; global stock markets experienced a modicum of relief. Indeed, in a classic relief rally fashion, Monday saw a rebound in the S&P 500, snapping a six-day losing streak.