- The index targets higher levels around 97.70.
- US Retail Sales missed expectations in April.
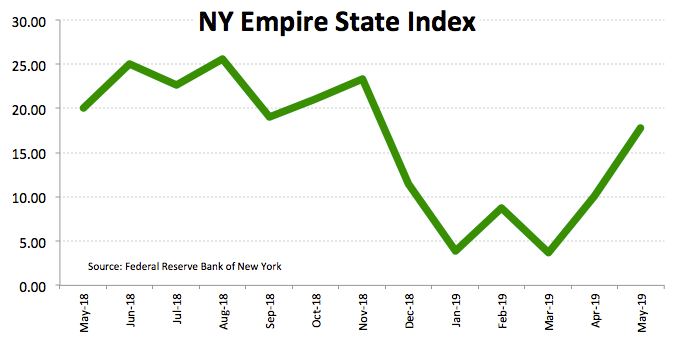
- NY Empire State index surprised to the upside in May.
The greenback has reversed the initial bearish note and moves to the upper end of the weekly range near 97.70 when gauged by the US Dollar Index (DXY).
US Dollar Index bid on trade, data
The index gathers extra steam following the continuation of the risk-off trade in the global markets, where the US-China trade war remains in centre stage and yields of the key US 10-year note have plummeted to sub-2.38% levels, levels last seen in late March.
Mixed results from the US docket has also lent further legs to the recovery in the buck, with the NY Empire State index coming in at 17.80 for the current month, bettering estimates. On the softer side, headline Retail Sales contracted at a monthly 0.2% during last month.
Additional data saw Industrial Production contracting at a monthly 0.5%, same result on Manufacturing Production and Capacity Utilization coming in at 77.9%, also below consensus.
Later in the session, the NAHB index is due seconded by Business Inventories, TIC Flows and speeches by FOMC’s R.Quarles (permanent voter, centrist) and Richmond Fed T.Barkin (2021 voter, centrist).
What to look for around USD
The centre of the debate for the greenback has shifted to the US-China trade dispute, although a high degree of uncertainty as well as caution among investors seem to prevail for the time being. On another direction, the lack of traction in US inflation – and concerns among Fed members – keeps weighing on the buck and threatens its underlying positive prospect. Occasional drops in the greenback, however, are seen shallow as the index stays supported by overseas weakness, the safe haven appeal, favourable yield spreads vs. the Fed’s G10 peers and the status of global reserve currency.
US Dollar Index relevant levels
At the moment, the pair is gaining 0.16% at 68 and a breach 97.03 (low May 13) would expose 96.73 (100-day SMA) and finally 96.32 (200-day SMA). On the upside, the next up barrier is located at 98.10 (high May 3) seconded by 98.32 (2019 high Apr.25) and then 98.97 (78.6% Fibo of the 2017-2018 drop).
Information on these pages contains forward-looking statements that involve risks and uncertainties. Markets and instruments profiled on this page are for informational purposes only and should not in any way come across as a recommendation to buy or sell in these assets. You should do your own thorough research before making any investment decisions. FXStreet does not in any way guarantee that this information is free from mistakes, errors, or material misstatements. It also does not guarantee that this information is of a timely nature. Investing in Open Markets involves a great deal of risk, including the loss of all or a portion of your investment, as well as emotional distress. All risks, losses and costs associated with investing, including total loss of principal, are your responsibility. The views and opinions expressed in this article are those of the authors and do not necessarily reflect the official policy or position of FXStreet nor its advertisers. The author will not be held responsible for information that is found at the end of links posted on this page.
If not otherwise explicitly mentioned in the body of the article, at the time of writing, the author has no position in any stock mentioned in this article and no business relationship with any company mentioned. The author has not received compensation for writing this article, other than from FXStreet.
FXStreet and the author do not provide personalized recommendations. The author makes no representations as to the accuracy, completeness, or suitability of this information. FXStreet and the author will not be liable for any errors, omissions or any losses, injuries or damages arising from this information and its display or use. Errors and omissions excepted.
The author and FXStreet are not registered investment advisors and nothing in this article is intended to be investment advice.
Recommended content
Editors’ Picks
EUR/USD holds above 1.0650 after US data

EUR/USD retreats from session highs but manages to hold above 1.0650 in the early American session. Upbeat macroeconomic data releases from the US helps the US Dollar find a foothold and limits the pair's upside.
GBP/USD retreats toward 1.2450 on modest USD rebound

GBP/USD edges lower in the second half of the day and trades at around 1.2450. Better-than-expected Jobless Claims and Philadelphia Fed Manufacturing Index data from the US provides a support to the USD and forces the pair to stay on the back foot.
Gold is closely monitoring geopolitics

Gold trades in positive territory above $2,380 on Thursday. Although the benchmark 10-year US Treasury bond yield holds steady following upbeat US data, XAU/USD continues to stretch higher on growing fears over a deepening conflict in the Middle East.
Ripple faces significant correction as former SEC litigator says lawsuit could make it to Supreme Court

Ripple (XRP) price hovers below the key $0.50 level on Thursday after failing at another attempt to break and close above the resistance for the fourth day in a row.
Have we seen the extent of the Fed rate repricing?

Markets have been mostly consolidating recent moves into Thursday. We’ve seen some profit taking on Dollar longs and renewed demand for US equities into the dip. Whether or not this holds up is a completely different story.