- DXY stays well bid in the 100.50 region on Thursday.
- President Trump’s comments gave extra support to the buck.
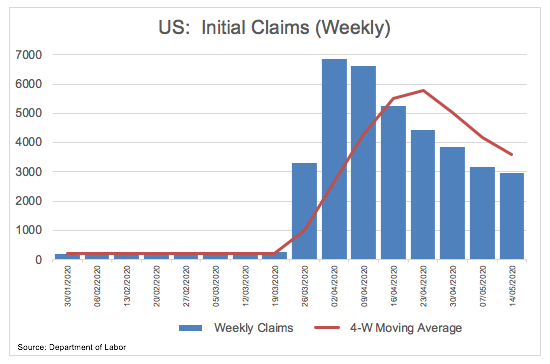
- US Initial Claims rose at a weekly 2.901 million.
The US Dollar Index (DXY), which gauges the greenback vs. a bundle of its main rivals, remains well bid around the 100.50 area on Thursday.
US Dollar Index set sails to 101.00
The index is advancing for the second session in a row on Thursday, extending the move to the area above the key barrier near 100.50 and printing at the same time new 3-week peaks.
In fact, the dollar met extra buying pressure as of late after Fed’s J.Powell reiterated that the Fed is not considering negative rates for the time being, while President Trump’s positive comments on the dollar’s strength also collaborated with the upbeat mood in the index.
Data wise, key Initial Claims prolonged the downtrend on Thursday, rising by nearly 3 million American citizens during last week. As per Continuing Claims, nearly 23 million citizens are now under unemployment insurance benefits.
What to look for around USD
The greenback keeps the buying interest well and sound so far this week against the backdrop of a generalized consolidative fashion in the global markets. In the meantime, the US-China trade war and the gradual re-opening of the US economy continue to be in the centre of the debate among investors. Supporting the momentum around the greenback emerges the current “flight-to-safety” environment, helped by its status of “global reserve currency” and store of value. On another front, and following the FOMC event, the Fed is expected to stay on the loose end of the monetary policy stance, at least until the coronavirus crisis abates.
US Dollar Index relevant levels
At the moment, the index is gaining 0.31% at 100.51 and a break above 100.93 (weekly/monthly high Apr.6) would open the door to 101.34 (monthly high Apr.10 2017) and finally 102.25 (monthly high Mar.9 2017). On the other hand, the next support is located at 98.57 (weekly low May 4) followed by 98.42 (200-day SMA) and then 97.87 (61.8% Fibo of the 2017-2018 drop).
Information on these pages contains forward-looking statements that involve risks and uncertainties. Markets and instruments profiled on this page are for informational purposes only and should not in any way come across as a recommendation to buy or sell in these assets. You should do your own thorough research before making any investment decisions. FXStreet does not in any way guarantee that this information is free from mistakes, errors, or material misstatements. It also does not guarantee that this information is of a timely nature. Investing in Open Markets involves a great deal of risk, including the loss of all or a portion of your investment, as well as emotional distress. All risks, losses and costs associated with investing, including total loss of principal, are your responsibility. The views and opinions expressed in this article are those of the authors and do not necessarily reflect the official policy or position of FXStreet nor its advertisers. The author will not be held responsible for information that is found at the end of links posted on this page.
If not otherwise explicitly mentioned in the body of the article, at the time of writing, the author has no position in any stock mentioned in this article and no business relationship with any company mentioned. The author has not received compensation for writing this article, other than from FXStreet.
FXStreet and the author do not provide personalized recommendations. The author makes no representations as to the accuracy, completeness, or suitability of this information. FXStreet and the author will not be liable for any errors, omissions or any losses, injuries or damages arising from this information and its display or use. Errors and omissions excepted.
The author and FXStreet are not registered investment advisors and nothing in this article is intended to be investment advice.
Recommended content
Editors’ Picks
EUR/USD retreats below 1.0700 after US GDP data

EUR/USD came under modest bearish pressure and retreated below 1.0700. Although the US data showed that the economy grew at a softer pace than expected in Q1, strong inflation-related details provided a boost to the USD.
GBP/USD declines below 1.2500 as USD rebounds

GBP/USD declined below 1.2500 and erased the majority of its daily gains with the immediate reaction to the US GDP report. The US economy expanded at a softer pace than expected in Q1 but the price deflator jumped to 3.4% from 1.8%.
Gold drops below $2,320 as US yields shoot higher

Gold lost its traction and turned negative on the day below $2,320 in the American session on Thursday. The benchmark 10-year US Treasury bond yield is up more than 1% on the day above 4.7% after US GDP report, weighing on XAU/USD.
XRP extends its decline, crypto experts comment on Ripple stablecoin and benefits for XRP Ledger

Ripple extends decline to $0.52 on Thursday, wipes out weekly gains. Crypto expert asks Ripple CTO how the stablecoin will benefit the XRP Ledger and native token XRP.
After the US close, it’s the Tokyo CPI

After the US close, it’s the Tokyo CPI, a reliable indicator of the national number and then the BoJ policy announcement. Tokyo CPI ex food and energy in Japan was a rise to 2.90% in March from 2.50%.