![]() HotForex Analysis Team
HotForex Analysis Team
HotForex
Honeywell, Nextera Energy and headed by Twitter, whose results exceeded its revenues and bucked users expectations growth rates during its previous report for the first annual quarter are expected to report profits for the second quarter of 2021 next week, at the end of July.
Twitter is an American microblogging and social networking service on which users post and interact with messages known as “tweets”. The site was founded in March 2006 by Jack Dorsey, Noah Glass, Biz Stone, and Evan Williams. While it was actually launched in July of the same year. It has also been very popular since its launch and the number of its active users reached 330 million people by Q1 2019.
Quoting from Twitter Inc.: Financial results for the second quarter of 2021 will be released on July 22, after the market closes. On the same day, Twitter will host a conference call to discuss these financial results.
The results of the company’s first-quarter profits exceeded expectations, though the share price fell by about 11% hours after the company issued its quarterly report last April, accompanied by an anticipation of a decline in revenues in the second quarter. Twitter reported a gain of about 16 cents per share, compared to only 14 cents expected by Refinitiv, “a British-American global provider of financial market data and infrastructure,” and revenue of about $1.04 billion, compared to $808 million for the same quarter last year, with a growth rate of about $1.04 billion (28%), contrary to expectations of about $1.03 billion by Refinitiv. The total number of users of the profitable site has also grown by about 7 million since the fourth quarter to reach $199 million instead of the 200 million expected by analysts. Twitter expects that the total revenue for the second quarter of the year will range between $980 million and $1.08 billion. Analysts expect $1.08 billion.
Twitter technical analysis
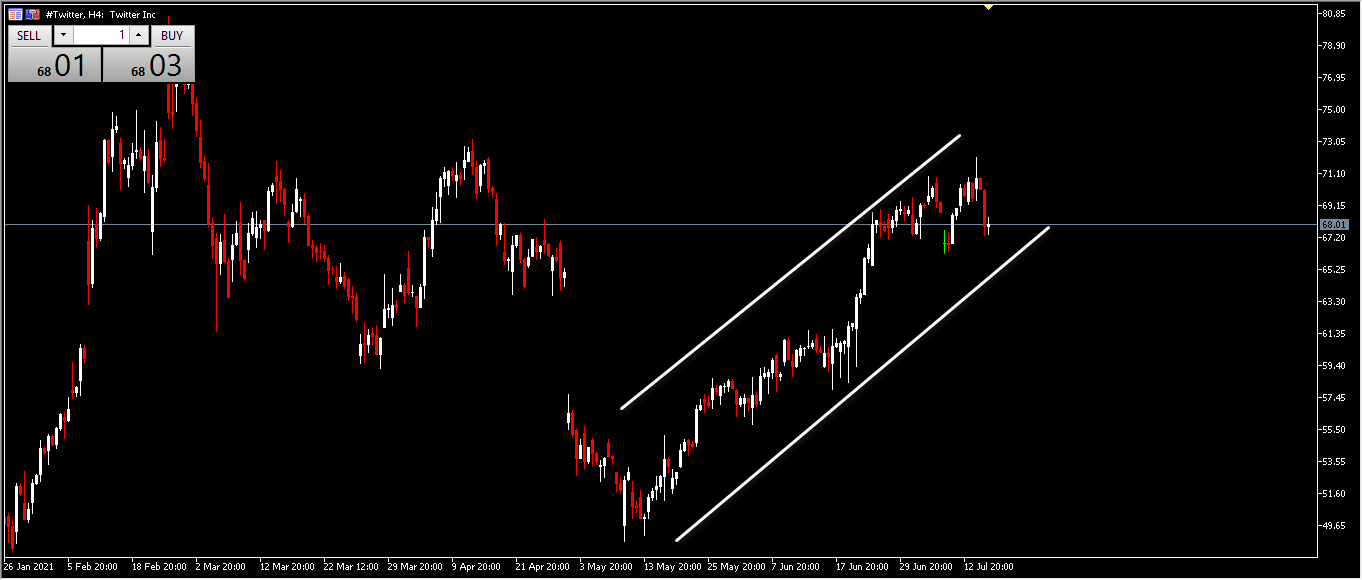
The following chart appears on the 4-hour time frame of the Twitter company; the share price has moved in an ascending channel since the beginning of the second quarter in the previous May, and it achieved the lowest price level at 48.68 per share, while the maximum price level came at 72.08. It is currently trading at 68.01.
The following figure reviews the main axes and levels of support and resistance. The main pivot appears at 70.54 and resistances at 71.63, 73.16 and 74.25, while we find support at 69.01, 67.92 and 66.39. The RSI has started to rise since May and has crossed the 70 level and made more than one peak above it at the end of June and the beginning of July, then it dropped to 49.36 .
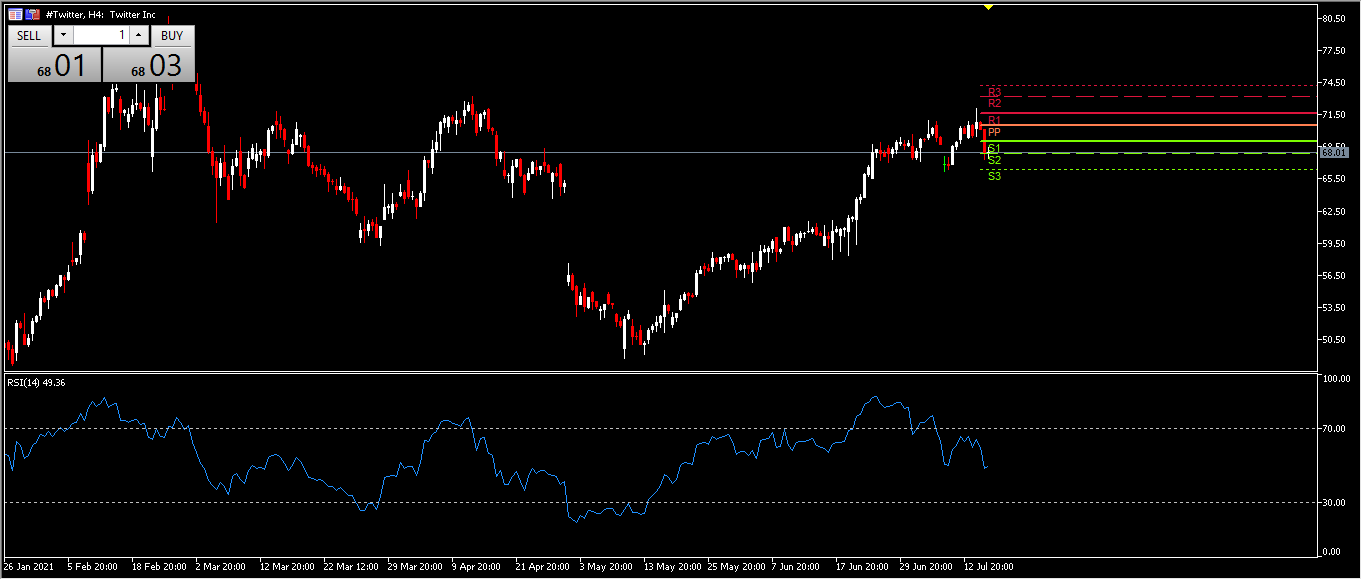
And then comes the Bollinger Bands indicator, which represents the trading lines and shows the extent of the market’s volatility by drawing a channel known as the volatility channel to identify potential resistance and support levels and oversold and overbought levels. It is an indicator that does not in any way indicate buy or sell signals; it is a tool for the purpose of illustrating only the relative rise and fall of prices.
It appears that the current level of the upper side of the Bollinger band is at 71.291, which connects the tops of the stock price movement and indicates the maximum price. We find the lower side of the channel at 66.685, which represents the lower limit of the price, and the mid-line of the channel comes at 68.988. The narrowness of the channel’s range becomes apparent on the 13th of last May, which indicates a sign of a rise in the price, and the narrowness of the channel was repeated at the beginning of the 8th of July. The stock’s price movement has since broken the middle line of the channel upwards, which indicates a positive sign for the price’s rise, and the price has remained broken since 18th of May to today. Also, the ATR, which determines the amount of the stock price movement over a specified period of time, is shown falling from 1.94 to 1.16 during the month of June and then rising again to reach 1.51 recently.

Honeywell
Honeywell is an American company established a technological field, was established in November 1999, is headquartered in Morris Blaine, New Jersey. The executive management is currently carried out by Darius Adamczyk. It operates in four main sectors: aerospace, construction, safety and productivity solutions, and performance materials and technologies.
On April 22, the Honeywell Company released its first quarterly report for 2021. The report included an increase in earnings per share to $1.92, exceeding analysts’ expectations of $1.80 per share, with an estimated difference of $0.12. In addition, the company achieved estimated profits of about $8.45 billion, compared to expectations of $8.07 billion. On an annual basis, there has been a decrease in revenues by approximately 0.1%. The company’s expectation is to achieve profits of between 1.89 and 1.91 and an average of about $1.90 for the second quarter.
Citing the company #Honeywell: The next annual quarter earnings report will be published on Friday, July 23rd 2021. Honeywell International Company will hold a conference call to discuss the results on Friday.
Honeywell technical analysis
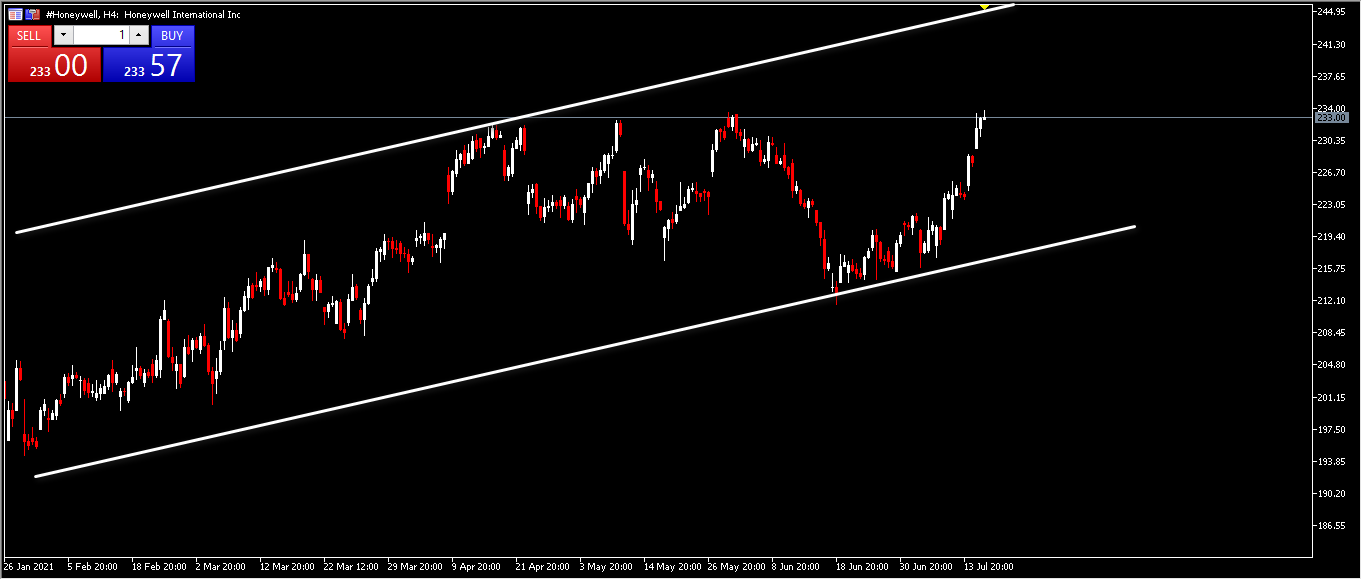
On the 4-hour chart, the stock price of Honeywell appears in an ascending channel since last March after surviving a sharp decline in the same month in which it achieved its lowest price level during the year at $100.49. It continued to rise until it reached the maximum price per share during the year at the level of 282.84 dollars, which is the level it is currently being traded towards.
The main pivot appears at 227.04 and resistances at 229.47, 231.16 and 233.59, while we find support at 225.35, 222.92 and 221.23. The RSI has increased since last June to the present day, to breach the highest level of 70 and achieve a value of 73.20, which indicates overbought.
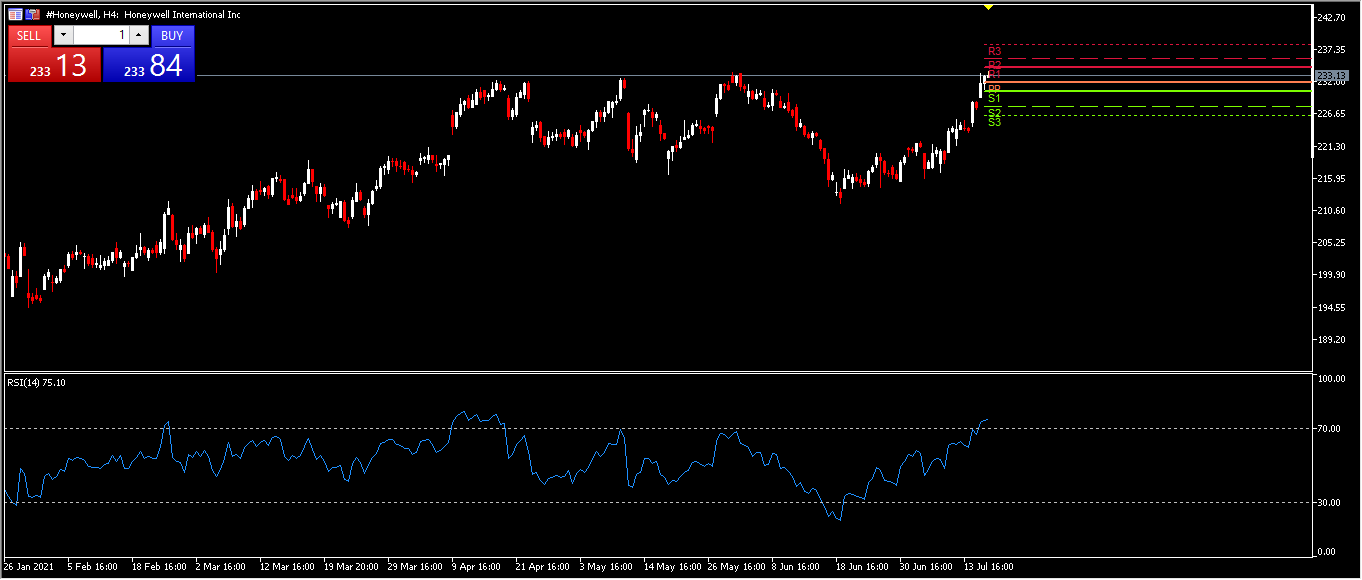
The chart of the Bollinger Bands indicator displays a widening in its range in the areas before the price drop on April 23, May 12 and June 2 and the channel was relatively narrow before the price started to rise on the 21st of last month. The upper band of the channel is currently recorded at 231.488, while the lower side is at 215.128. The share price crossed the mid-line of the channel on June 21, which indicates a sign that the price has risen and continued to breach, and even shows a breach to the upper side of the range recently. The 14- ATR has been on the rise since the beginning of this month, reaching a value of 2.80.

NextEra energy
NextEra Energy is one of America’s largest capital investors in infrastructure, with between $50 and $55 billion in new infrastructure investments planned through 2022, we’re helping ensure that the next energy to power our dreams will be American energy.
The earnings report for the first quarter of 2021 for NextEra Energy, listed on the New York Stock Exchange, was released last April. It indicated net income on the basis of generally accepted accounting principles (GAAP) at a value of 1,666 million dollars, equivalent to 0.84 dollars per share, compared to 421 million dollars, or 0.21 dollars per share in the same quarter of last year 2020, on an adjusted basis. The company’s profit for the first quarter of 2021 amounted to about $1,330 million, or the equivalent of $0.67 per share, compared to $1,170 million, or $0.59 per share in the first quarter of 2020. To read more details, you can view the company’s financial report through the following link:
NextEra technical analysis
The following chart of the price movement shows that the price started in the ascending channel on May 18th, after falling $10 from $81 to $71. It also reached its lowest price at 68.30 last March before rising during the second quarter to achieve the price of 76.81, which is the current trading price.
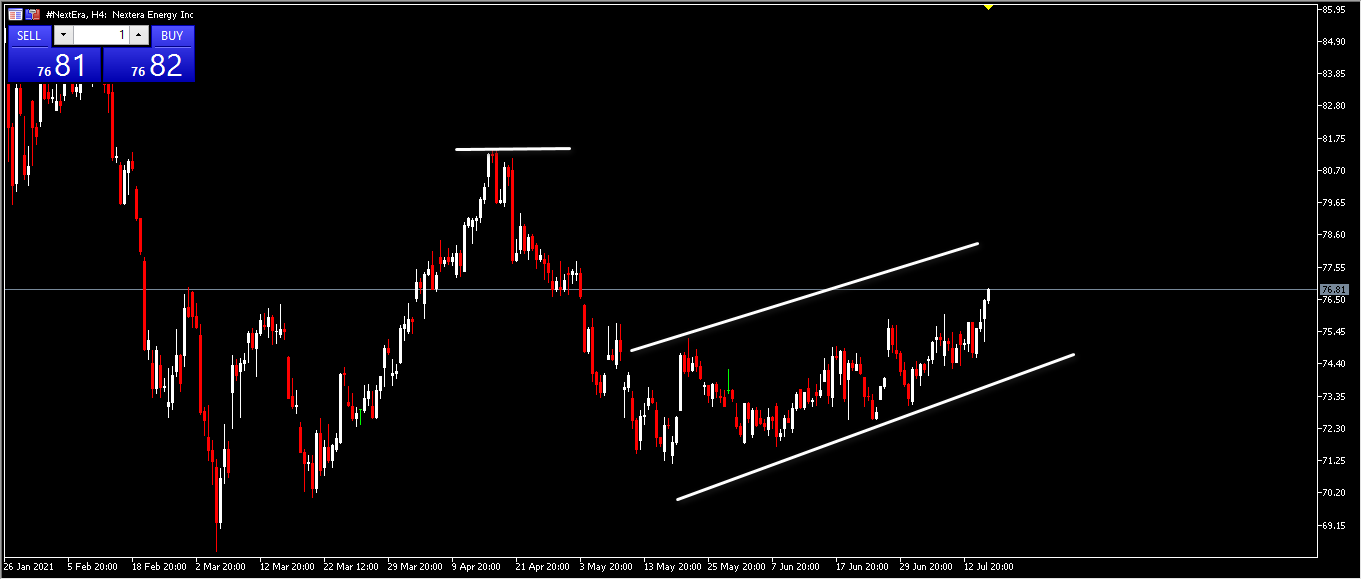
The main pivot appears at 75.51 and resistances at 76.40, 77.05 and 77.94, while we find supports at 74.86, 73.97 and 73.32. The RSI has increased since May 19 to this day, approaching the level of 70 and achieving a value of 65.89, which indicates an increase in the purchase of shares.
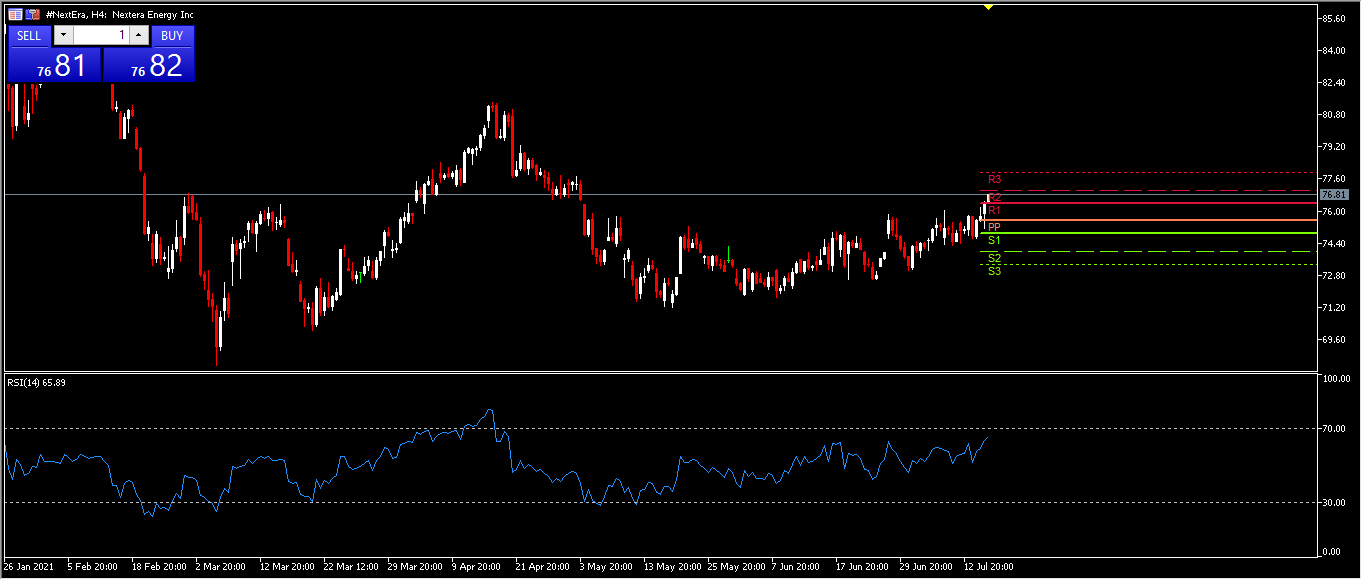
The Bollinger Bands indicator during the second quarter of 2021 was relatively tight in comparison with the first quarter. The upper range of the volatility channel is at 76.49, while the lower side comes at b73.67. Currently the price has settled above the mid-line of the channel, where it has been since the beginning of July, suggesting a rise in the share price this month. ATR meanwhile is at 0.86.

Disclaimer: Nothing in this communication contains, or should be considered as containing, an investment advice or an investment recommendation or a solicitation for the purpose of purchase or sale of any financial instrument.
Recommended content
Editors’ Picks
EUR/USD rises toward 1.0700 after Germany and EU PMI data

EUR/USD gains traction and rises toward 1.0700 in the European session on Monday. HCOB Composite PMI data from Germany and the Eurozone came in better than expected, providing a boost to the Euro. Focus shifts US PMI readings.
GBP/USD holds above 1.2350 after UK PMIs

GBP/USD clings to modest daily gains above 1.2350 in the European session on Tuesday. The data from the UK showed that the private sector continued to grow at an accelerating pace in April, helping Pound Sterling gather strength.
Gold price flirts with $2,300 amid receding safe-haven demand, reduced Fed rate cut bets

Gold price (XAU/USD) remains under heavy selling pressure for the second straight day on Tuesday and languishes near its lowest level in over two weeks, around the $2,300 mark heading into the European session.
Here’s why Ondo price hit new ATH amid bearish market outlook Premium

Ondo price shows no signs of slowing down after setting up an all-time high (ATH) at $1.05 on March 31. This development is likely to be followed by a correction and ATH but not necessarily in that order.
US S&P Global PMIs Preview: Economic expansion set to keep momentum in April

S&P Global Manufacturing PMI and Services PMI are both expected to come in at 52 in April’s flash estimate, highlighting an ongoing expansion in the private sector’s economic activity.