- It has been a mixed day in the equities markets and the VIX has reflected that.
- The volatility index is now 0.18% lower at 27.9 on Thursday.
Fundamental backdrop
It has been a mixed session in the equities markets on Tuesday. All of the major cash markets are trading in the red, led by the Dow which currently trades 0.78% lower. In terms of winners and losers (S&P 500), CBOE global is struggling down around 10% after the company completed its acquisition of EuroCCP, the pan-European equities clearing house last week. CBOE was also downgraded to “neutral” from “overweight” at Piper Sandler as the research firmed cited lighter volumes. On the topside, Rollins are up over 8% as the firm anticipates Q2 revenue to grow low to mid-single digits against the consensus of -7.8% from USD 523.96mln revenue in 2Q19.
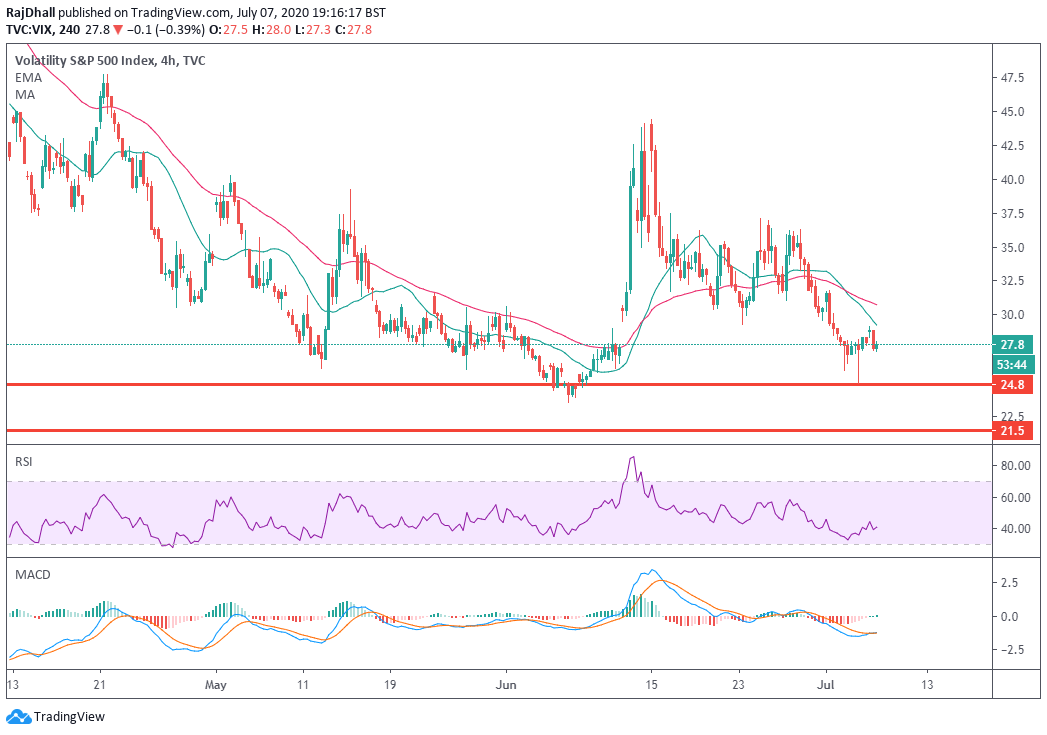
Technical levels (4-hour chart)
Looking at the chart, after a blip higher at the start of the session the VIX has now dropped. The price is in a clear downtrend since 15th June and this latest move could cement the index's status below 30 which could also be the next resistance point. On the downside, the main support is around 24.9. This is where the price met some support with the red hammer candle on Monday's session. Below that, the main support on the chart is at 21.5 as if this level breaks it would take the VIX into its historical normal range.
All information and content on this website, from this website or from FX daily ltd. should be viewed as educational only. Although the author, FX daily ltd. and its contributors believe the information and contents to be accurate, we neither guarantee their accuracy nor assume any liability for errors. The concepts and methods introduced should be used to stimulate intelligent trading decisions. Any mention of profits should be considered hypothetical and may not reflect slippage, liquidity and fees in live trading. Unless otherwise stated, all illustrations are made with the benefit of hindsight. There is risk of loss as well as profit in trading. It should not be presumed that the methods presented on this website or from material obtained from this website in any manner will be profitable or that they will not result in losses. Past performance is not a guarantee of future results. It is the responsibility of each trader to determine their own financial suitability. FX daily ltd. cannot be held responsible for any direct or indirect loss incurred by applying any of the information obtained here. Futures, forex, equities and options trading contains substantial risk, is not for every trader, and only risk capital should be used. Any form of trading, including forex, options, hedging and spreads, contains risk. Past performance is not indicative of future FX daily ltd. are not Registered Financial Investment Advisors, securities brokers-dealers or brokers of the U.S. Securities and Exchange Commission or with any state securities regulatory authority OR UK FCA. We recommend consulting with a registered investment advisor, broker-dealer, and/or financial advisor. If you choose to invest, with or without seeking advice, then any consequences resulting from your investments are your sole responsibility FX daily ltd. does not assume responsibility for any profits or losses in any stocks, options, futures or trading strategy mentioned on the website, newsletter, online trading room or trading classes. All information should be taken as educational purposes only.
Recommended content
Editors’ Picks
AUD/USD hovers around 0.6500 amid light trading, ahead of US GDP

AUD/USD is trading close to 0.6500 in Asian trading on Thursday, lacking a clear directional impetus amid an Anzac Day holiday in Australia. Meanwhile, traders stay cautious due ti risk-aversion and ahead of the key US Q1 GDP release.
USD/JPY finds its highest bids since 1990, approaches 156.00

USD/JPY broke into its highest chart territory since June of 1990 on Wednesday, peaking near 155.40 for the first time in 34 years as the Japanese Yen continues to tumble across the broad FX market.
Gold stays firm amid higher US yields as traders await US GDP data

Gold recovers from recent losses, buoyed by market interest despite a stronger US Dollar and higher US Treasury yields. De-escalation of Middle East tensions contributed to increased market stability, denting the appetite for Gold buying.
Ethereum suffers slight pullback, Hong Kong spot ETH ETFs to begin trading on April 30

Ethereum suffered a brief decline on Wednesday afternoon despite increased accumulation from whales. This follows Ethereum restaking protocol Renzo restaked ETH crashing from its 1:1 peg with ETH and increased activities surrounding spot Ethereum ETFs.
Dow Jones Industrial Average hesitates on Wednesday as markets wait for key US data

The DJIA stumbled on Wednesday, falling from recent highs near 38,550.00 as investors ease off of Tuesday’s risk appetite. The index recovered as US data continues to vex financial markets that remain overwhelmingly focused on rate cuts from the US Fed.