- Tesla finally makes a move and charges through $750.
- Volume profile should set Tesla up for a push to $780.
- TSLA outperforms the broad market on Tuesday.
Tesla has finally pushed above some key levels we have been calling for over the last few days. The first level it needs to break was $730 as this was the range from the middle of July. Once above there that turned the trend slightly more bullish, but the real aim was for Tesla stock (Nasdaq:TSLA) to get through and hold above $750. This is where volume begins to thin out, meaning any further moves should be easier to sustain for Tesla. The summer has been choppy for the stock with any moves hard to sustain as it appears to want to go higher but has been hit with some serious headwinds along the way. The fact that the stock has still managed to trade higher only serves to add to the bullish argument for Tesla. We have had the China crackdown on tech and EV stocks and then safety investigations, but still Tesla has just about managed to keep going. Last week Elon Musk tweeted about a delay to the Roadster. The stock has progressed in spite of this.
-637666898687698998.png)
TSLA 15-minute chart
We can see from the chart above that the move was strong straight from the open, and the remainder of the day was spent consolidating that early move.
Tesla key statistics
| Market Cap | $745 billion |
| Price/Earnings | 354 |
| Price/Sales | 23 |
| Price/Book | 29 |
| Enterprise Value | $756 billion |
| Gross Margin | 22% |
| Net Margin |
6% |
| 52-week high | $900.40 |
| 52-week low | $329.88 |
| Average Wall Street Rating and Price Target | Hold, $711 |
Tesla stock forecast
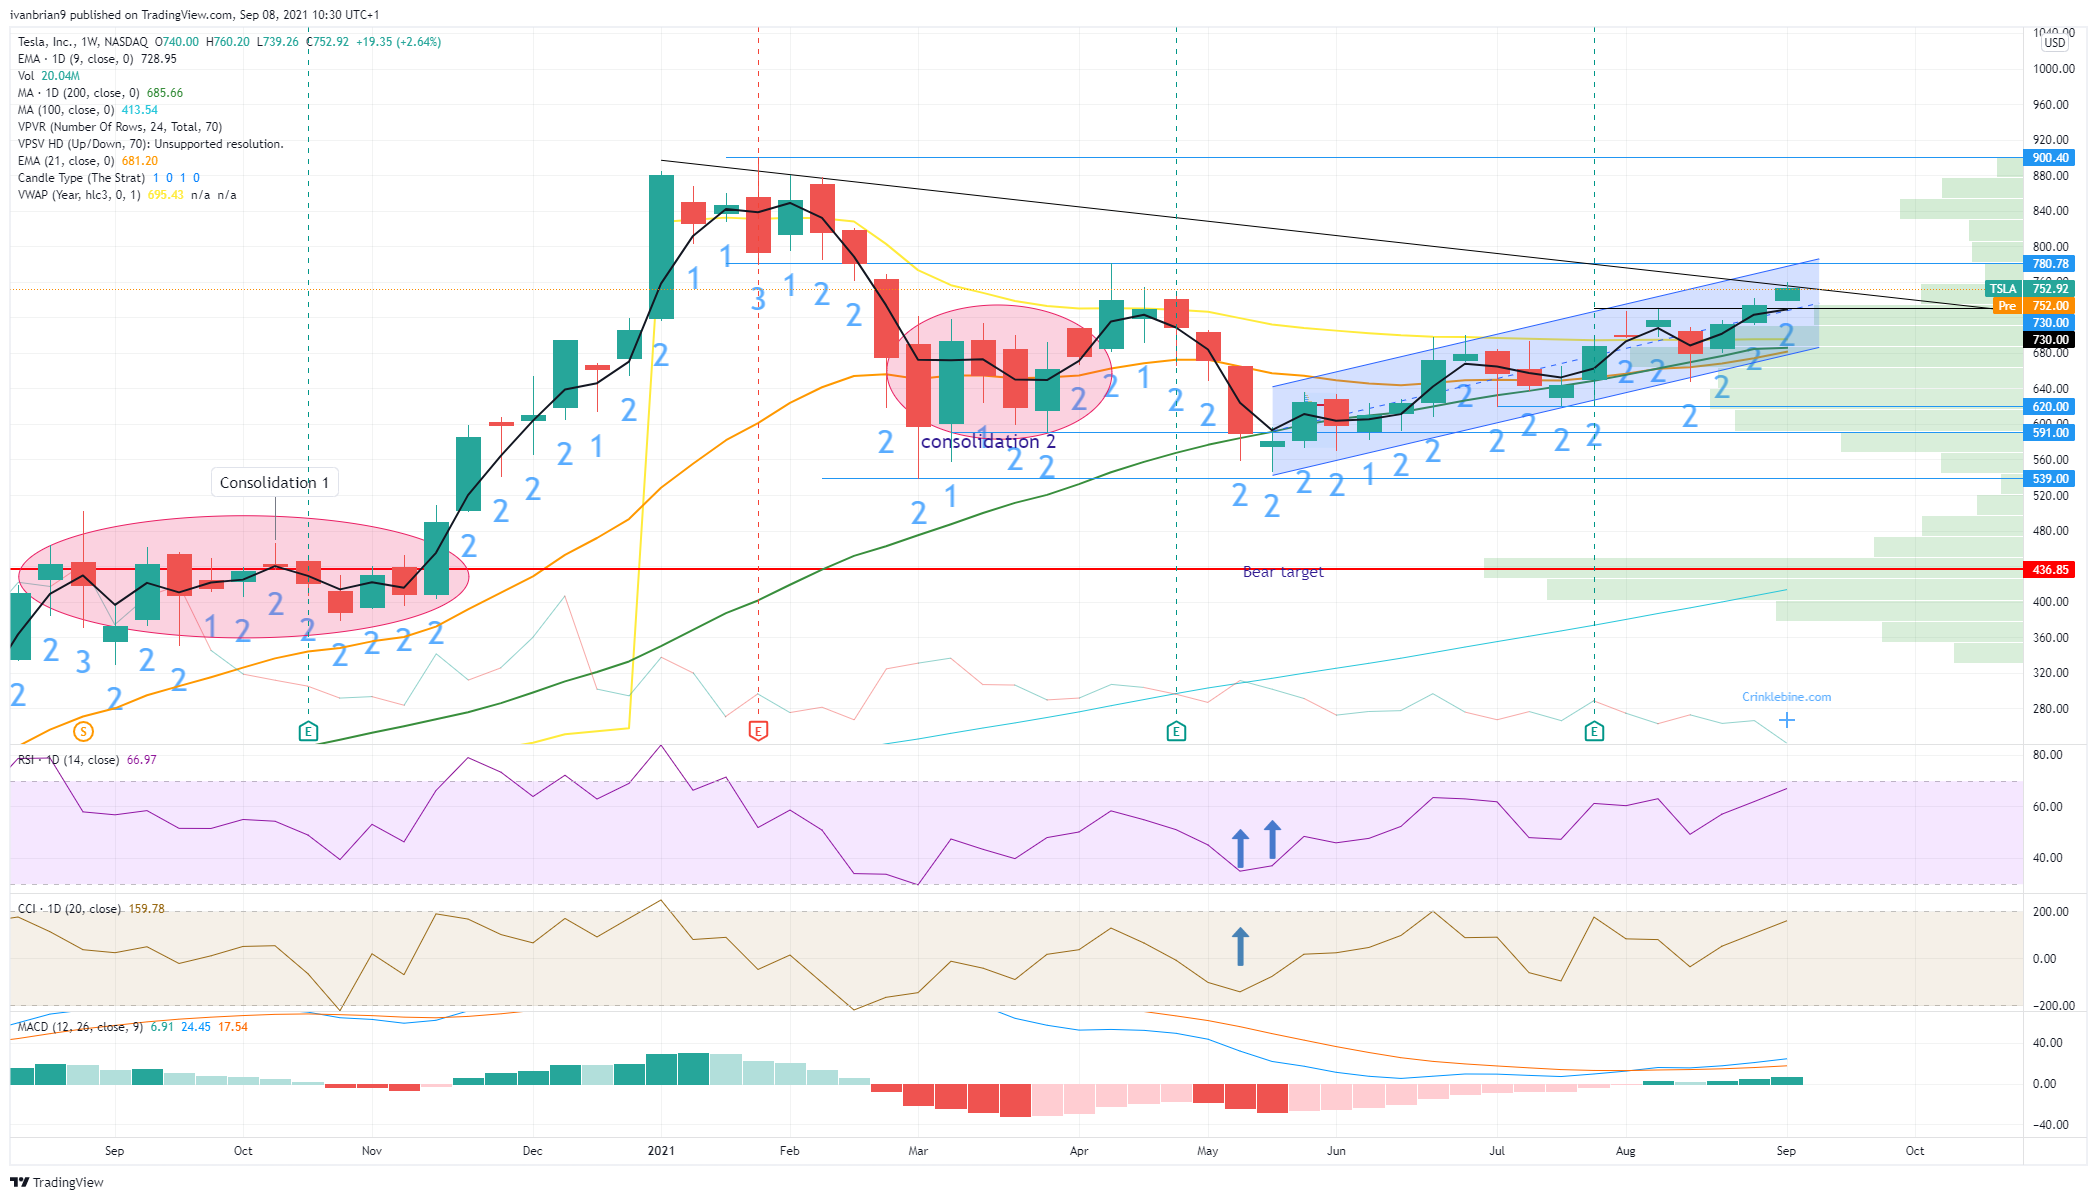
The uptrend channel remains intact as we can see from the weekly chart first. Also this shows us the triangle formation, which gives us some resistance at $757. Due to the lack of volume, this is not a strong resistance. We can see why Tesla has the potential for a move higher now that it has broken out into an area of light volume. Based on the weekly chart, this long zone we have been in since March is actually a consolidation and retest of the breakout from November and December of 2020. Breakouts are fine and a retest of the breakout level only adds to the bullish case.
Returning to the daily chart we are now in a low volume zone, which extends until $845. Resistance along the way from the trend line as mentioned at $757, but $780 is the stronger level as it is the high from April. Tesla is bullish in our view above $730, neutral from $730 to $650 and bearish below $650.
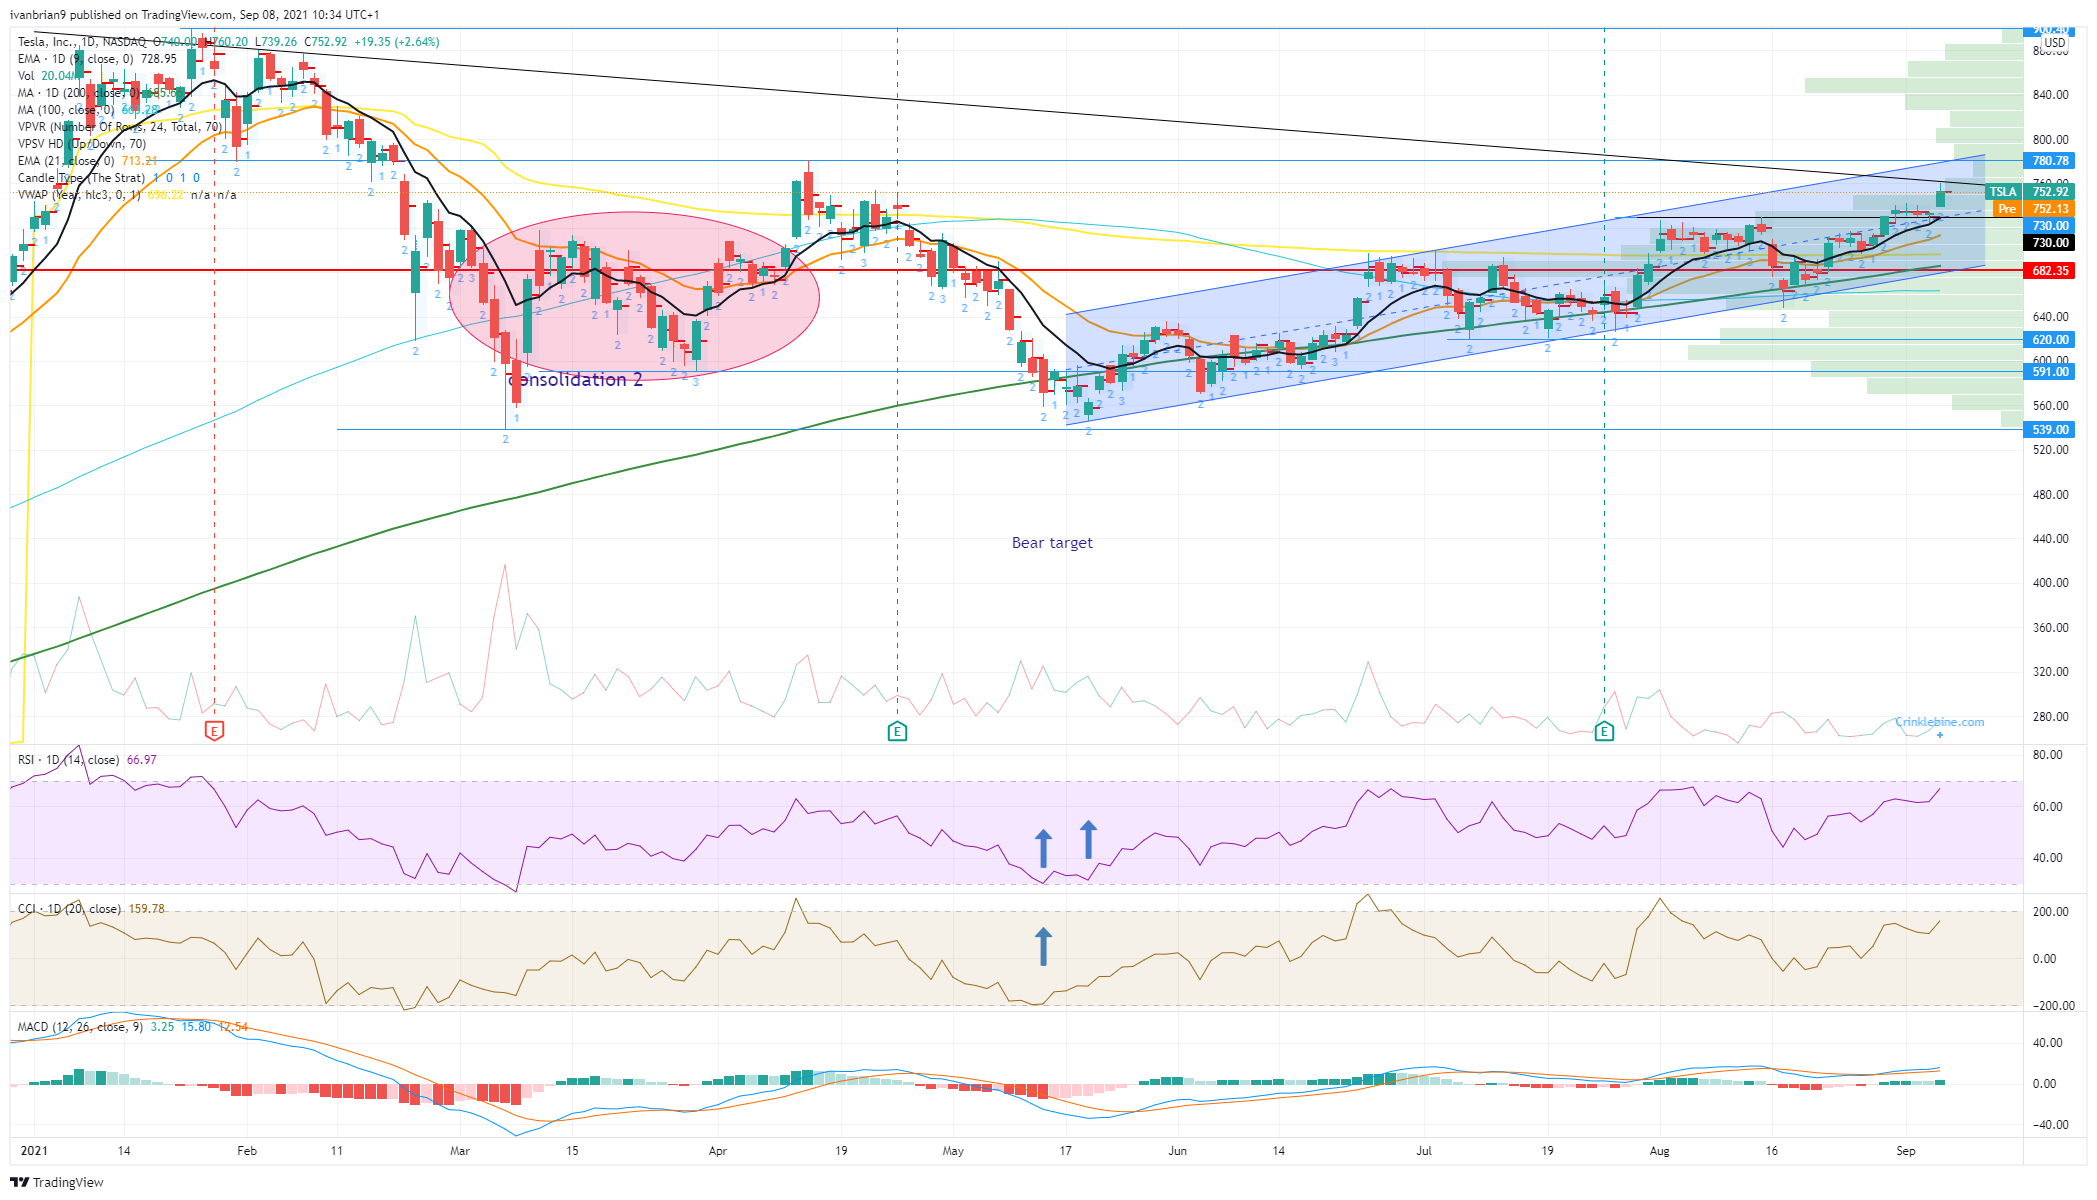
TSLA 1-day chart
Information on these pages contains forward-looking statements that involve risks and uncertainties. Markets and instruments profiled on this page are for informational purposes only and should not in any way come across as a recommendation to buy or sell in these assets. You should do your own thorough research before making any investment decisions. FXStreet does not in any way guarantee that this information is free from mistakes, errors, or material misstatements. It also does not guarantee that this information is of a timely nature. Investing in Open Markets involves a great deal of risk, including the loss of all or a portion of your investment, as well as emotional distress. All risks, losses and costs associated with investing, including total loss of principal, are your responsibility. The views and opinions expressed in this article are those of the authors and do not necessarily reflect the official policy or position of FXStreet nor its advertisers. The author will not be held responsible for information that is found at the end of links posted on this page.
If not otherwise explicitly mentioned in the body of the article, at the time of writing, the author has no position in any stock mentioned in this article and no business relationship with any company mentioned. The author has not received compensation for writing this article, other than from FXStreet.
FXStreet and the author do not provide personalized recommendations. The author makes no representations as to the accuracy, completeness, or suitability of this information. FXStreet and the author will not be liable for any errors, omissions or any losses, injuries or damages arising from this information and its display or use. Errors and omissions excepted.
The author and FXStreet are not registered investment advisors and nothing in this article is intended to be investment advice.
Recommended content
Editors’ Picks
AUD/USD failed just ahead of the 200-day SMA

Finally, AUD/USD managed to break above the 0.6500 barrier on Wednesday, extending the weekly recovery, although its advance faltered just ahead of the 0.6530 region, where the key 200-day SMA sits.
EUR/USD met some decent resistance above 1.0700

EUR/USD remained unable to gather extra upside traction and surpass the 1.0700 hurdle in a convincing fashion on Wednesday, instead giving away part of the weekly gains against the backdrop of a decent bounce in the Dollar.
Gold keeps consolidating ahead of US first-tier figures

Gold finds it difficult to stage a rebound midweek following Monday's sharp decline but manages to hold above $2,300. The benchmark 10-year US Treasury bond yield stays in the green above 4.6% after US data, not allowing the pair to turn north.
Bitcoin price could be primed for correction as bearish activity grows near $66K area

Bitcoin (BTC) price managed to maintain a northbound trajectory after the April 20 halving, despite bold assertions by analysts that the event would be a “sell the news” situation. However, after four days of strength, the tables could be turning as a dark cloud now hovers above BTC price.
Bank of Japan's predicament: The BOJ is trapped

In this special edition of TradeGATEHub Live Trading, we're joined by guest speaker Tavi @TaviCosta, who shares his insights on the Bank of Japan's current predicament, stating, 'The BOJ is Trapped.'