- S&P 500 set yet another record high on Thursday.
- US CPI data was not enough to stop the running of the bulls.
- Slow and steady as technicals and fundamentals remain supportive.
US stocks all performed well on Thursday as the US CPI was high but not too high to cause the sell-off that bears had been hoping for. Inflation has moved to multi-year highs, but this has now been well flagged and accepted by market participants. Even the Fed has come to the acceptance that it may have problems with inflation going forward, but it remains committed to ultra-loose monetary policy. With such backstop equities have nothing to do but keep going up. This they duly did on Thursday with the S&P 500 making another new record high.
S&P 500 (SPY, ES, SPX) technical analysis
Traders use one of two means to trace the broad S&P index, the S&P 500 futures (with the E-mini being the most popular) or the SPY Exchange Traded Fund. Both track it almost identically. Using the actual index takes away the ability to use volume indicators, which can be powerful technical analysis tools. Using the futures chart, 4,050 remains as the double bottom from May 12 and 19, which prompted the rally. Volume was low at this level, which led to the price rejection and move higher. This 4,050 area also corresponds to strong support from the trendline in place from the Oct 30 low from last year.
The move is slow and steady as can be witnessed with the divergence from the OnBalance Volume (OBV) indicator. This is a market breadth momentum indicator that basically plots positive days' volume against negative days' volume. A divergence can signal a reversal, so this needs to be watched. Simple market breadth is positive, the number of advancing stocks - declining stocks. Other momentum indicators remain neutral – both the Relative Strength Index (RSI) and Commodity Channel Index (CCI).
The 4,180 was a big level for the S&P 500 futures to get through as can be seen from the volume profile bar on the right of the chart and also the relative balance between bulls and bears in this bar (red and green). Once through here, the index had to push higher. This will serve as a strong support zone on any retracement. A break below 4,050 should see a move through some light volume profile areas to 3,920, the point of control since September 2020 (i.e. the strongest and highest volume, fair value area).

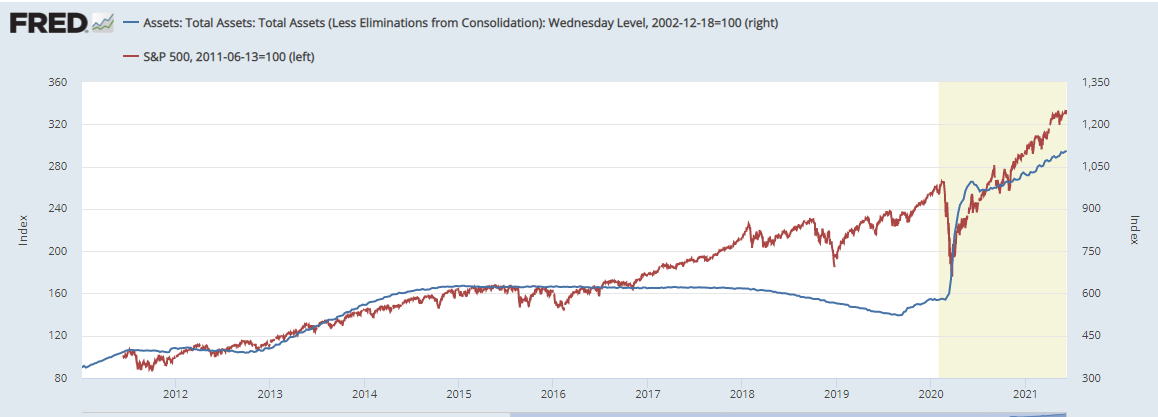
The sentiment and momentum still favours the upside. The Fed's balance sheet has been nicely correlated with equites since 2008 basically and the start of ultra-loose monetary policy. A new record was set again in the most recent data, and the S&P took the lead and made new record highs on Thursday.
Information on these pages contains forward-looking statements that involve risks and uncertainties. Markets and instruments profiled on this page are for informational purposes only and should not in any way come across as a recommendation to buy or sell in these assets. You should do your own thorough research before making any investment decisions. FXStreet does not in any way guarantee that this information is free from mistakes, errors, or material misstatements. It also does not guarantee that this information is of a timely nature. Investing in Open Markets involves a great deal of risk, including the loss of all or a portion of your investment, as well as emotional distress. All risks, losses and costs associated with investing, including total loss of principal, are your responsibility. The views and opinions expressed in this article are those of the authors and do not necessarily reflect the official policy or position of FXStreet nor its advertisers. The author will not be held responsible for information that is found at the end of links posted on this page.
If not otherwise explicitly mentioned in the body of the article, at the time of writing, the author has no position in any stock mentioned in this article and no business relationship with any company mentioned. The author has not received compensation for writing this article, other than from FXStreet.
FXStreet and the author do not provide personalized recommendations. The author makes no representations as to the accuracy, completeness, or suitability of this information. FXStreet and the author will not be liable for any errors, omissions or any losses, injuries or damages arising from this information and its display or use. Errors and omissions excepted.
The author and FXStreet are not registered investment advisors and nothing in this article is intended to be investment advice.
Recommended content
Editors’ Picks
EUR/USD clings to daily gains above 1.0650

EUR/USD gained traction and turned positive on the day above 1.0650. The improvement seen in risk mood following the earlier flight to safety weighs on the US Dollar ahead of the weekend and helps the pair push higher.
GBP/USD recovers toward 1.2450 after UK Retail Sales data

GBP/USD reversed its direction and advanced to the 1.2450 area after touching a fresh multi-month low below 1.2400 in the Asian session. The positive shift seen in risk mood on easing fears over a deepening Iran-Israel conflict supports the pair.
Gold holds steady at around $2,380 following earlier spike

Gold stabilized near $2,380 after spiking above $2,400 with the immediate reaction to reports of Israel striking Iran. Meanwhile, the pullback seen in the US Treasury bond yields helps XAU/USD hold its ground.
Bitcoin Weekly Forecast: BTC post-halving rally could be partially priced in Premium

Bitcoin price shows no signs of directional bias while it holds above $60,000. The fourth BTC halving is partially priced in, according to Deutsche Bank’s research.
Week ahead – US GDP and BoJ decision on top of next week’s agenda

US GDP, core PCE and PMIs the next tests for the Dollar. Investors await BoJ for guidance about next rate hike. EU and UK PMIs, as well as Australian CPIs also on tap.