- US stocks jumped following a US bank holiday, up between 1.78% and 3.07%.
- The Nasdaq Composite leads the pack, followed by the S&P 500 and the Dow Jones.
- US Treasury yields edge up while the US Dollar Index drops.
US stocks are opening with hefty gains, following a dismal week, which dragged the SP 500 officially to a bear market after plunging more than 20% from all-time-highs, but as North American traders returned from a long weekend, US equities depict an upbeat market mood.
The S&P 500 is gaining some 2.51%, trading at 3,766.49, while the tech-heavy Nasdaq Composite (NDQ) is back above the 11,000 threshold, rallying 3.07%, at 11,130.10. The laggard in the session, but jumping more than 500 points, is the Dow Jones Industrial Average (DJIA), up 1.78%, advancing to 30,419.48.
In the meantime, the US Dollar Index extends its losses in the week and sits around 104.290, down by 0.11%. US Treasury yields remain elevated, and the US 10-year note yields 3.288%, up by two basis points.
Fundamentally nothing has changed, and some financial analysts perceive the rally as a “death cat bounce.” Last Wednesday, the US Federal Reserve hiked 75 bps rates, the biggest move since 1994, and Fed’s Chief Powell said that although those moves would not be “common,” he stated that in July, another 75 bps might be on the table.
Sector-wise, the leading gainers are Energy, up 4.85%, followed by Consumer Discretionary and Technology, each recording gains of 3.42% and 2.91%, respectively. The laggards but also positive in the day are Utilities, Consumer Staples, and Materials, up by 1.27%, 1.40%, and 1.60% each.
In the commodities complex, the US crude oil benchmark, WTI, grinds higher by 2.69%, trading at $110.88 BPD. At the same time, precious metals like gold (XAU/USD) followed suit, edging higher 0.29%, exchanging hands at $1845.65 a troy ounce.
SP 500 Chart
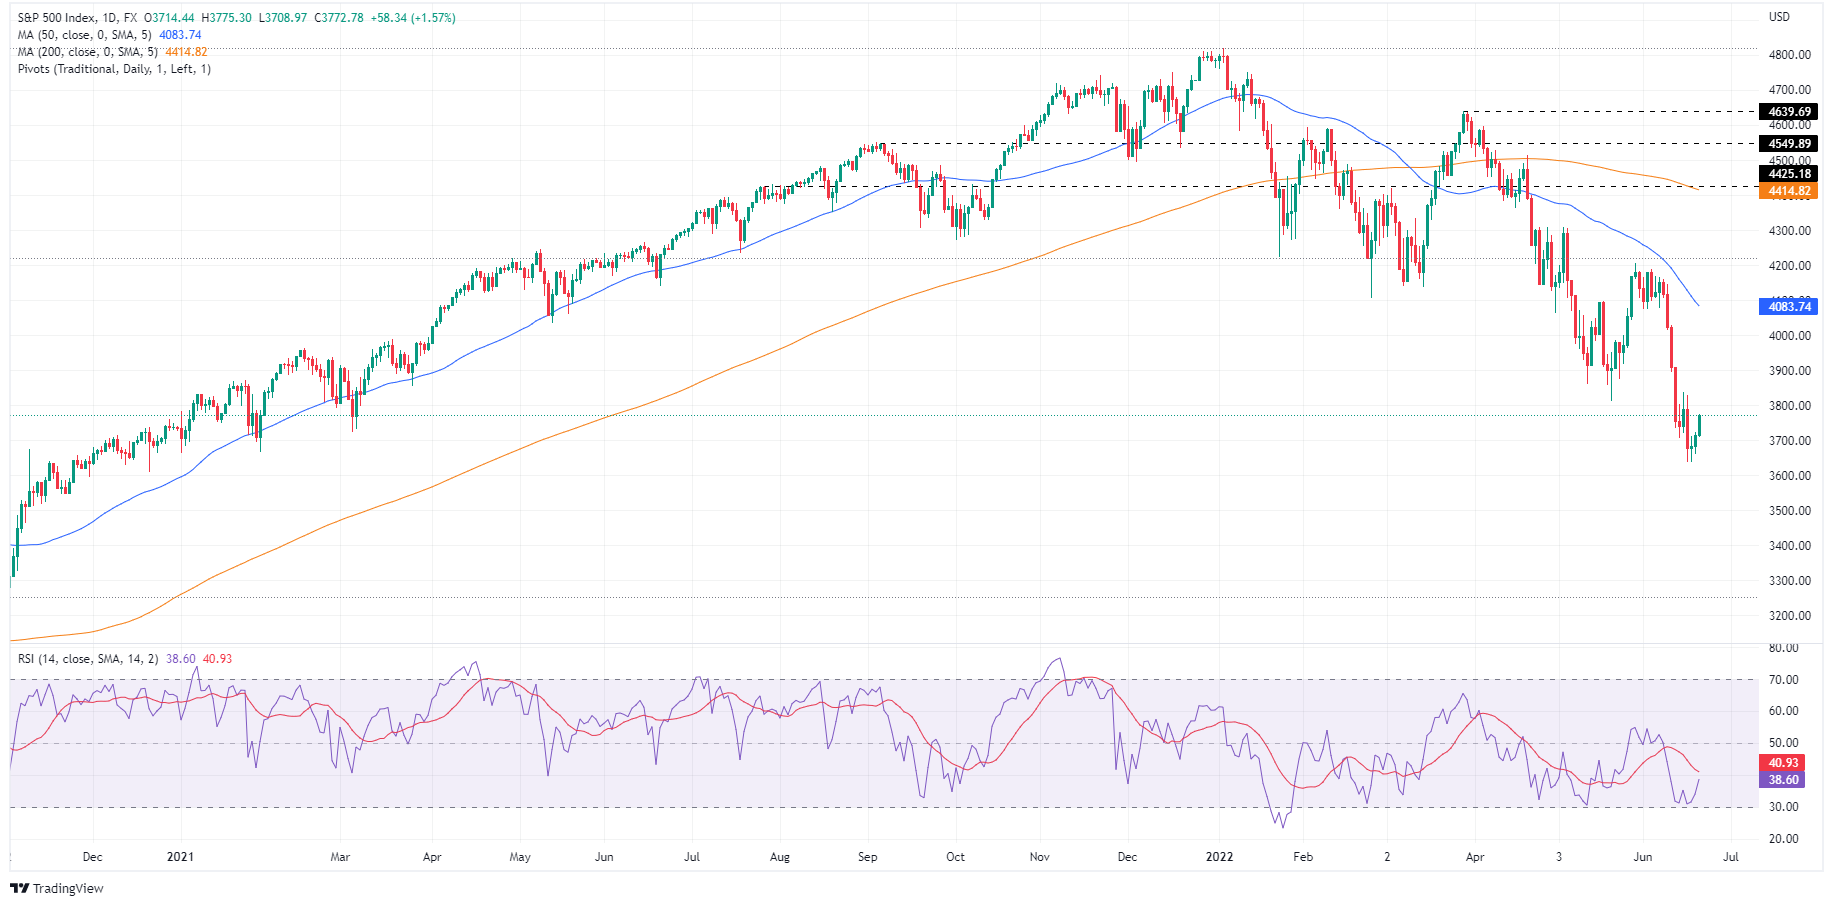
Key Technical Levels
Information on these pages contains forward-looking statements that involve risks and uncertainties. Markets and instruments profiled on this page are for informational purposes only and should not in any way come across as a recommendation to buy or sell in these assets. You should do your own thorough research before making any investment decisions. FXStreet does not in any way guarantee that this information is free from mistakes, errors, or material misstatements. It also does not guarantee that this information is of a timely nature. Investing in Open Markets involves a great deal of risk, including the loss of all or a portion of your investment, as well as emotional distress. All risks, losses and costs associated with investing, including total loss of principal, are your responsibility. The views and opinions expressed in this article are those of the authors and do not necessarily reflect the official policy or position of FXStreet nor its advertisers. The author will not be held responsible for information that is found at the end of links posted on this page.
If not otherwise explicitly mentioned in the body of the article, at the time of writing, the author has no position in any stock mentioned in this article and no business relationship with any company mentioned. The author has not received compensation for writing this article, other than from FXStreet.
FXStreet and the author do not provide personalized recommendations. The author makes no representations as to the accuracy, completeness, or suitability of this information. FXStreet and the author will not be liable for any errors, omissions or any losses, injuries or damages arising from this information and its display or use. Errors and omissions excepted.
The author and FXStreet are not registered investment advisors and nothing in this article is intended to be investment advice.
Recommended content
Editors’ Picks
AUD/USD hovers around 0.6500 amid light trading, ahead of US GDP

AUD/USD is trading close to 0.6500 in Asian trading on Thursday, lacking a clear directional impetus amid an Anzac Day holiday in Australia. Meanwhile, traders stay cautious due ti risk-aversion and ahead of the key US Q1 GDP release.
USD/JPY finds its highest bids since 1990, near 155.50

USD/JPY keeps breaking into its highest chart territory since June of 1990 early Thursday, testing 155.50 for the first time in 34 years as the Japanese Yen remains vulnerable, despite looming Japanese intervention risks. Focus shifts to Thursday's US GDP report and the BoJ decision on Friday.
Gold price treads water near $2,320, awaits US GDP data

Gold price recovers losses but keeps its range near $2,320 early Thursday. Renewed weakness in the US Dollar and the US Treasury yields allow Gold buyers to breathe a sigh of relief. Gold price stays vulnerable amid Middle East de-escalation, awaiting US Q1 GDP data.
Injective price weakness persists despite over 5.9 million INJ tokens burned
Injective price is trading with a bearish bias, stuck in the lower section of the market range. The bearish outlook abounds despite the network's deflationary efforts to pump the price. Coupled with broader market gloom, INJ token’s doomed days may not be over yet.
Meta Platforms Earnings: META sinks 10% on lower Q2 revenue guidance Premium

This must be "opposites" week. While Doppelganger Tesla rode horrible misses on Tuesday to a double-digit rally, Meta Platforms produced impressive beats above Wall Street consensus after the close on Wednesday, only to watch the share price collapse by nearly 10%.