- SOS shares continue to stabilize despite Bitcoin's bumbles.
- The cloud-services-turned-crypto-miner's shares are a well-followed retail meme stock.
- SOS sheds 2% in Wednesday's pre-market after a strong showing on Thursday.
SOS is a Chinese company involved in providing cloud-based emergency services to businesses and individuals. SOS provides information security solutions for emergency roadside assistance, emergency healthcare and emergency living assistance. SOS also has an involvement in the cryptocurrency mining business.
Stay up to speed with hot stocks' news!
SOS stock forecast
SOS shares have been strong in 2021 with a gain of 190% plus so far. The main reason for this has been the company getting involved in the cryptocurrency mining sector and blockchain.
SOS is the subject of much hype, rumor and frenzy, so it needs to be treated and traded accordingly. This is not a Buffet-style, long-term play. It is a stock to trade the momentum, reap the rewards and get out before it is too late. So careful risk management and identifying key chart points and trends are important.
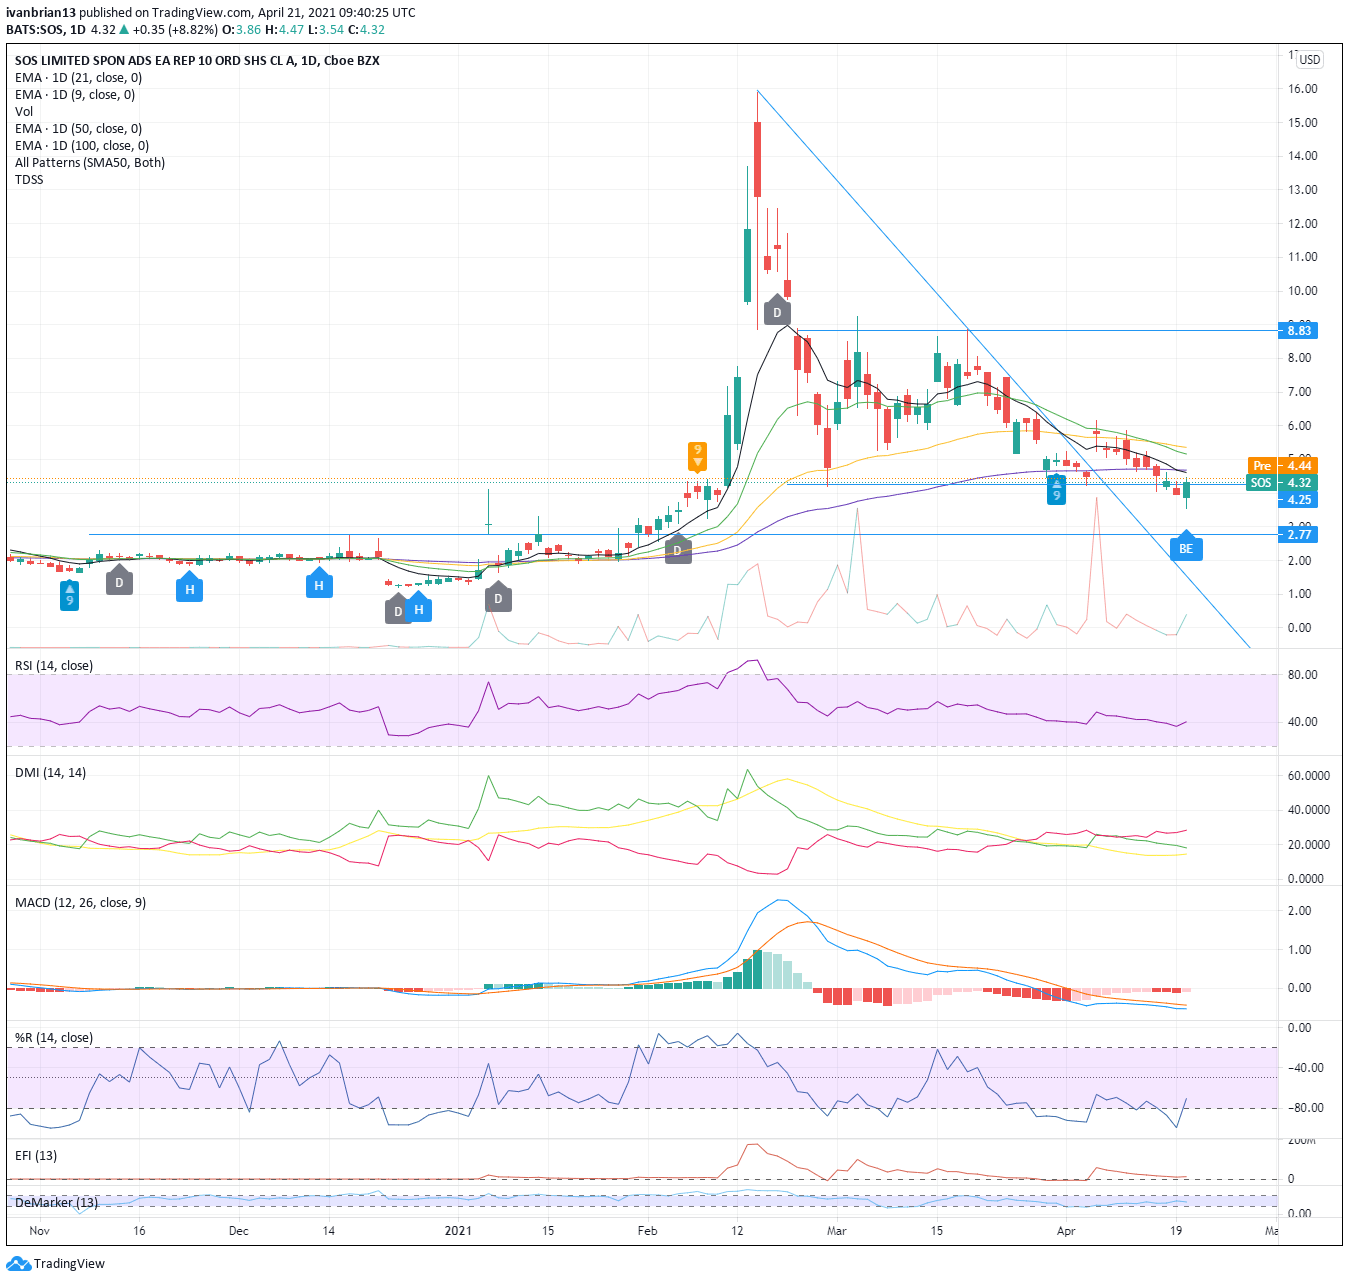
The initial spike up to nearly $16 was too fast, too furious as SOS was much too stretched. This was peak GameStop retail frenzy. This spike has never come even close to being matched. Further spikes gave us the downward sloping trend line that SOS broke through on April 7. SOS shares rallied 28% on this day amid rumours of a short squeeze across many social media sites.
Since this aggressive move, SOS shares have fallen steadily. This move also failed at the significant 100-day moving average resistance.
Now we have some confusion in the chart. Ordinarily, we have bearish signals as SOS has broken the lower range line at $4.25. MACD is still crossed into bearish territory and the DMI is also crossed into bearish territory. To trade the bearish view effectively use the $4.67 area to initiate short positions as this is resistance from the 9 and 100-day moving average. A tight stop should be used on a break of these averages. A break lower leads to a target of $2.77. It should be noted given the volatility in retail meme stocks that going short is better achieved using put options to manage risk.
Tuesday has produced a bullish engulfing candle, which may halt the recent slide. Taking a long position the initial target will be the convergence of the 9 and 100-day moving avearges at $4.67 and further resistance/targets are at $5.16-$5.36 from the 21 and 50-day moving averages. The April 7 high of $6.17 will be the pivot for any bullish move. Here it may be prudent to significanlty reduce longs.
The author has no position in any stock mentioned in this article and no business relationship with any company mentioned. The author has not received compensation for writing this article, other than from FXStreet.
This article is for information purposes only. The author and FXStreet are not registered investment advisors and nothing in this article is intended to be investment advice. It is important to perform your own research before making any investment and take independent advice from a registered investment advisor.
FXStreet and the author do not provide personalized recommendations. The author makes no representations as to accuracy, completeness, or the suitability of this information. FXStreet and the author will not be liable for any errors, omissions or any losses, injuries or damages arising from this information and its display or use. The author will not be held responsible for information that is found at the end of links posted on this page.
Errors and omissions excepted.
Information on these pages contains forward-looking statements that involve risks and uncertainties. Markets and instruments profiled on this page are for informational purposes only and should not in any way come across as a recommendation to buy or sell in these assets. You should do your own thorough research before making any investment decisions. FXStreet does not in any way guarantee that this information is free from mistakes, errors, or material misstatements. It also does not guarantee that this information is of a timely nature. Investing in Open Markets involves a great deal of risk, including the loss of all or a portion of your investment, as well as emotional distress. All risks, losses and costs associated with investing, including total loss of principal, are your responsibility. The views and opinions expressed in this article are those of the authors and do not necessarily reflect the official policy or position of FXStreet nor its advertisers. The author will not be held responsible for information that is found at the end of links posted on this page.
If not otherwise explicitly mentioned in the body of the article, at the time of writing, the author has no position in any stock mentioned in this article and no business relationship with any company mentioned. The author has not received compensation for writing this article, other than from FXStreet.
FXStreet and the author do not provide personalized recommendations. The author makes no representations as to the accuracy, completeness, or suitability of this information. FXStreet and the author will not be liable for any errors, omissions or any losses, injuries or damages arising from this information and its display or use. Errors and omissions excepted.
The author and FXStreet are not registered investment advisors and nothing in this article is intended to be investment advice.
Recommended content
Editors’ Picks
EUR/USD extends gains above 1.0700, focus on key US data

EUR/USD meets fresh demand and rises toward 1.0750 in the European session on Thursday. Renewed US Dollar weakness offsets the risk-off market environment, supporting the pair ahead of the key US GDP and PCE inflation data.
USD/JPY keeps pushing higher, eyes 156.00 ahead of US GDP data

USD/JPY keeps breaking into its highest chart territory since June of 1990 early Thursday, recapturing 155.50 for the first time in 34 years as the Japanese Yen remains vulnerable, despite looming intervention risks. The focus shifts to Thursday's US GDP report and the BoJ decision on Friday.
Gold closes below key $2,318 support, US GDP holds the key

Gold price is breathing a sigh of relief early Thursday after testing offers near $2,315 once again. Broad risk-aversion seems to be helping Gold find a floor, as traders refrain from placing any fresh directional bets on the bright metal ahead of the preliminary reading of the US first-quarter GDP due later on Thursday.
Injective price weakness persists despite over 5.9 million INJ tokens burned
Injective price is trading with a bearish bias, stuck in the lower section of the market range. The bearish outlook abounds despite the network's deflationary efforts to pump the price.
Meta takes a guidance slide amidst the battle between yields and earnings

Meta's disappointing outlook cast doubt on whether the market's enthusiasm for artificial intelligence. Investors now brace for significant macroeconomic challenges ahead, particularly with the release of first-quarter GDP data.