- Silver corrects from a fresh five-month high touched earlier this Tuesday.
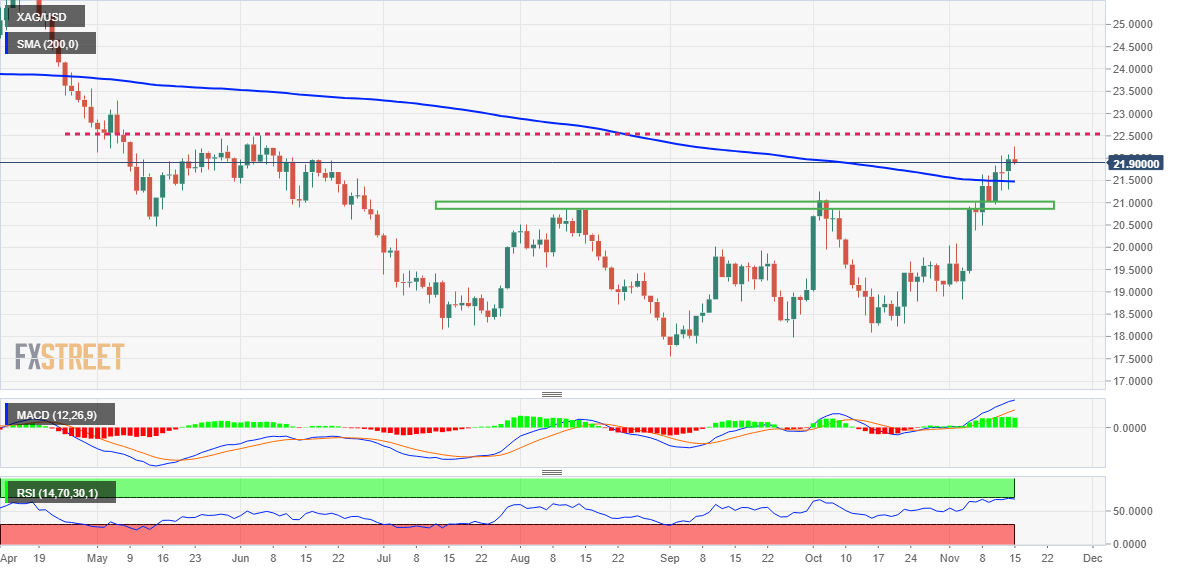
- Acceptance above the 200-day SMA supports prospects for further gains.
- A break below the $21.00 mark is needed to negate the positive outlook.
Silver retreats from the $22.25 area, or its highest level since July 7 touched earlier this Tuesday and drops to a fresh daily low during the mid-European session. The white metal is currently trading just below the $22.00 round-figure mark, down over 0.50% for the day.
Given that RSI (14) remains close to overbought territory, bulls seem inclined to take some profits off the table following the recent rally of around 18% from the monthly low touched on November 3. That said, acceptance above a technically significant 200-day SMA for the first time since April supports prospects for a further near-term appreciating move.
Hence, any subsequent fall is more likely to find decent support and attract fresh buyers around the $21.45 region (200 DMA). This should limit the downside for the XAGUSD near the $21.20-$21.15 area. This is closely followed by the $21.00 mark, which if broken decisively will negate the positive outlook and shift the bias in favour of bearish traders.
The XAGUSD might then turn vulnerable to weaken below the $21.00 mark - a strong horizontal resistance breakpoint now turned support - and test the next relevant support near the $20.40-$20.35 region. The corrective slide could further get extended towards the $20.00 psychological mark en route to the $19.65-$19.60 zone and the $19.10-$19.00 support zone.
On the flip side, momentum back above the $22.00 mark now seems to confront resistance near the daily swing high, around the $22.25 region. A sustained strength beyond will reaffirm the constructive outlook and lift the XAGUSD towards the $22.50-$22.60 supply zone. Bulls might eventually aim to reclaim the $23.00 round figure and test the $23.25-$23.30 hurdle.
Silver daily chart
Key levels to watch
Information on these pages contains forward-looking statements that involve risks and uncertainties. Markets and instruments profiled on this page are for informational purposes only and should not in any way come across as a recommendation to buy or sell in these assets. You should do your own thorough research before making any investment decisions. FXStreet does not in any way guarantee that this information is free from mistakes, errors, or material misstatements. It also does not guarantee that this information is of a timely nature. Investing in Open Markets involves a great deal of risk, including the loss of all or a portion of your investment, as well as emotional distress. All risks, losses and costs associated with investing, including total loss of principal, are your responsibility. The views and opinions expressed in this article are those of the authors and do not necessarily reflect the official policy or position of FXStreet nor its advertisers. The author will not be held responsible for information that is found at the end of links posted on this page.
If not otherwise explicitly mentioned in the body of the article, at the time of writing, the author has no position in any stock mentioned in this article and no business relationship with any company mentioned. The author has not received compensation for writing this article, other than from FXStreet.
FXStreet and the author do not provide personalized recommendations. The author makes no representations as to the accuracy, completeness, or suitability of this information. FXStreet and the author will not be liable for any errors, omissions or any losses, injuries or damages arising from this information and its display or use. Errors and omissions excepted.
The author and FXStreet are not registered investment advisors and nothing in this article is intended to be investment advice.
Recommended content
Editors’ Picks
EUR/USD regains traction, recovers above 1.0700

EUR/USD regained its traction and turned positive on the day above 1.0700 in the American session. The US Dollar struggles to preserve its strength after the data from the US showed that the economy grew at a softer pace than expected in Q1.
GBP/USD returns to 1.2500 area in volatile session

GBP/USD reversed its direction and recovered to 1.2500 after falling to the 1.2450 area earlier in the day. Although markets remain risk-averse, the US Dollar struggles to find demand following the disappointing GDP data.
Gold holds around $2,330 after dismal US data

Gold fell below $2,320 in the early American session as US yields shot higher after the data showed a significant increase in the US GDP price deflator in Q1. With safe-haven flows dominating the markets, however, XAU/USD reversed its direction and rose above $2,340.
XRP extends its decline, crypto experts comment on Ripple stablecoin and benefits for XRP Ledger

Ripple extends decline to $0.52 on Thursday, wipes out weekly gains. Crypto expert asks Ripple CTO how the stablecoin will benefit the XRP Ledger and native token XRP.
After the US close, it’s the Tokyo CPI

After the US close, it’s the Tokyo CPI, a reliable indicator of the national number and then the BoJ policy announcement. Tokyo CPI ex food and energy in Japan was a rise to 2.90% in March from 2.50%.