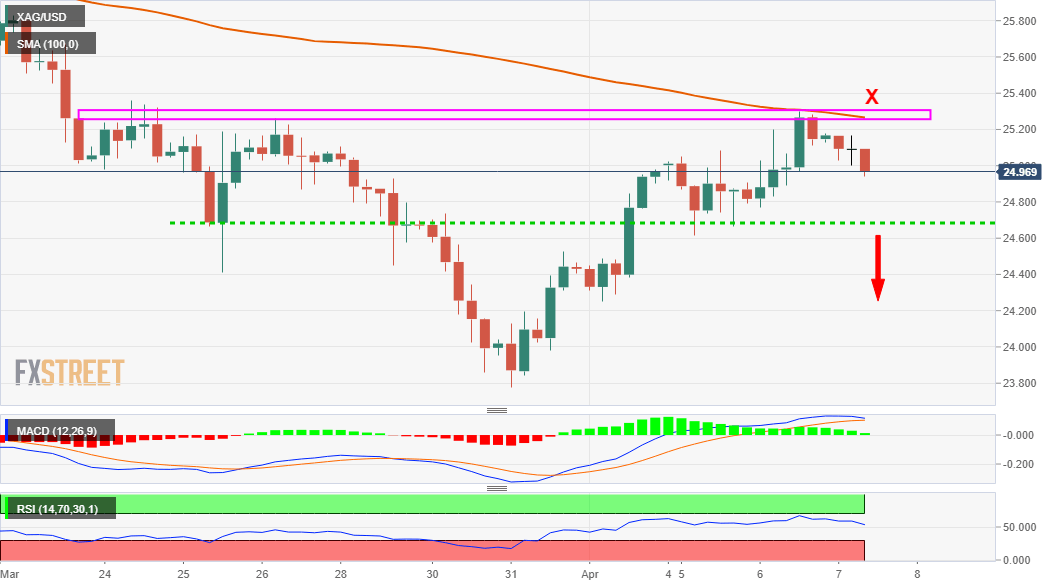
- Silver struggled to capitalize on the previous day’s positive move to two-week tops.
- The emergence of fresh selling near the $25.30 supply zone favours bearish traders.
- Bearish oscillators on the daily chart add credence to the near-term negative outlook.
Silver witnessed some selling through the first half of the trading action on Wednesday and eroded a part of the previous day's positive move to two-week tops. The commodity was last seen trading just below the $25.00 psychological mark, down 0.80% for the day.
The XAG/USD once again struggled to make it through the $25.30 supply zone and for now, seems to have stalled its recent recovery move from YTD lows. The mentioned barrier should now act as a key pivotal point for traders and help determine the near-term trajectory.
Meanwhile, technical indicators on the daily chart are still holding in the bearish territory and have just started gaining negative momentum on the 1-hour chart. Given repeated failures near the mentioned barrier, the set-up supports prospects for further losses.
From current levels, weekly swing lows, around the $24.60 region now seems to protect the immediate downside. Some follow-through selling now seems to accelerate the fall towards the $24.00 mark before the XAG/USD eventually drops to the $23.80-75 region (YTD lows).
On the flip side, bulls are likely to wait for a sustained move beyond the $25.30 strong barrier before positioning for any further gains. The XAG/USD might then surpass an intermediate resistance near the $25.55-60 region and aim to reclaim the $26.00 mark.
XAG/USD 4-hour chart
Technical levels to watch
Information on these pages contains forward-looking statements that involve risks and uncertainties. Markets and instruments profiled on this page are for informational purposes only and should not in any way come across as a recommendation to buy or sell in these assets. You should do your own thorough research before making any investment decisions. FXStreet does not in any way guarantee that this information is free from mistakes, errors, or material misstatements. It also does not guarantee that this information is of a timely nature. Investing in Open Markets involves a great deal of risk, including the loss of all or a portion of your investment, as well as emotional distress. All risks, losses and costs associated with investing, including total loss of principal, are your responsibility. The views and opinions expressed in this article are those of the authors and do not necessarily reflect the official policy or position of FXStreet nor its advertisers. The author will not be held responsible for information that is found at the end of links posted on this page.
If not otherwise explicitly mentioned in the body of the article, at the time of writing, the author has no position in any stock mentioned in this article and no business relationship with any company mentioned. The author has not received compensation for writing this article, other than from FXStreet.
FXStreet and the author do not provide personalized recommendations. The author makes no representations as to the accuracy, completeness, or suitability of this information. FXStreet and the author will not be liable for any errors, omissions or any losses, injuries or damages arising from this information and its display or use. Errors and omissions excepted.
The author and FXStreet are not registered investment advisors and nothing in this article is intended to be investment advice.
Recommended content
Editors’ Picks
EUR/USD holds above 1.0650 after US data

EUR/USD retreats from session highs but manages to hold above 1.0650 in the early American session. Upbeat macroeconomic data releases from the US helps the US Dollar find a foothold and limits the pair's upside.
GBP/USD retreats toward 1.2450 on modest USD rebound

GBP/USD edges lower in the second half of the day and trades at around 1.2450. Better-than-expected Jobless Claims and Philadelphia Fed Manufacturing Index data from the US provides a support to the USD and forces the pair to stay on the back foot.
Gold clings to strong daily gains above $2,380

Gold trades in positive territory above $2,380 on Thursday. Although the benchmark 10-year US Treasury bond yield holds steady following upbeat US data, XAU/USD continues to stretch higher on growing fears over a deepening conflict in the Middle East.
Ripple faces significant correction as former SEC litigator says lawsuit could make it to Supreme Court

Ripple (XRP) price hovers below the key $0.50 level on Thursday after failing at another attempt to break and close above the resistance for the fourth day in a row.
Have we seen the extent of the Fed rate repricing?

Markets have been mostly consolidating recent moves into Thursday. We’ve seen some profit taking on Dollar longs and renewed demand for US equities into the dip. Whether or not this holds up is a completely different story.