- Silver attracted some buying on Friday, albeit lacked any follow-through buying.
- The set-up favours bearish traders and supports prospects for additional losses.
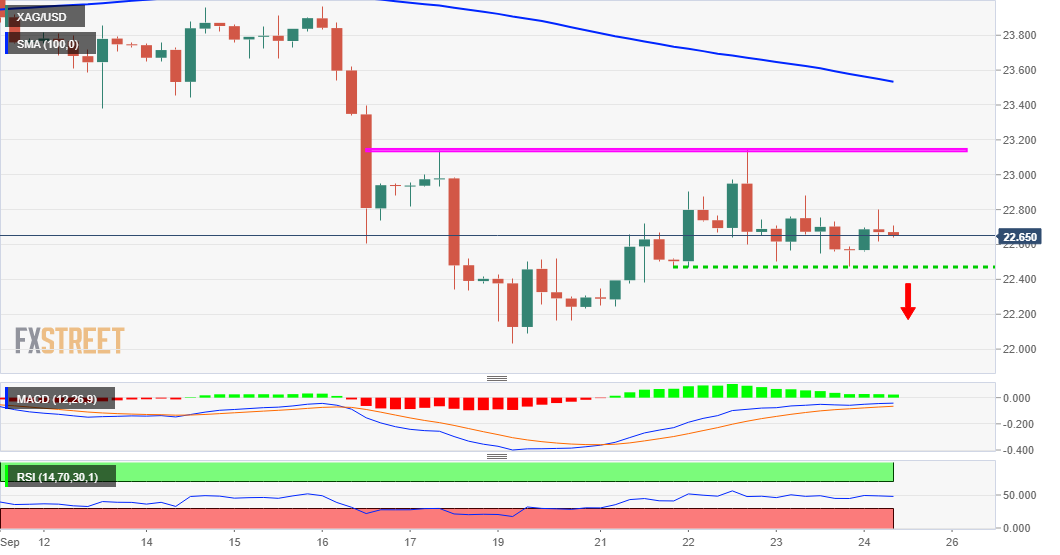
- A sustained break below the $22.50-45 area is needed to reaffirm the negative bias.
Silver regained positive traction on Friday and reversed the previous day's modest losses, albeit lacked strong follow-through buying. The commodity held on to its gains through the first half of the European session and was last seen trading around the $22.65 region, up over 0.60% for the day.
From a technical perspective, the post-FOMC bullish spike on Wednesday struggled to find acceptance above the $23.00 round-figure mark. The subsequent pullback from the $23.15 region constitutes the formation of a bearish double-top on hourly charts and supports prospects for further losses.
The negative outlook is reinforced by the fact that technical indicators on the daily chart are still holding deep in the bearish territory. Moreover, oscillators on the 4-hour chart – though have managed to recover from lower levels – have been struggling to gain any meaningful traction.
However, it will be prudent to wait for sustained weakness below the $22.50-45 horizontal support before positioning for any further depreciating move. The XAG/USD might then accelerate the slide back towards challenging YTD lows, around the $22.00 round-figure mark touched earlier this week.
On the flip side, any subsequent positive move might continue to confront stiff resistance near the $23.00 mark and remain capped near the $23.15 region. A sustained move beyond might trigger a short-covering move and lift the XAG/USD towards the $23.70 area en-route $24.00 mark.
Silver 4-hour chart
Technical levels to watch
Information on these pages contains forward-looking statements that involve risks and uncertainties. Markets and instruments profiled on this page are for informational purposes only and should not in any way come across as a recommendation to buy or sell in these assets. You should do your own thorough research before making any investment decisions. FXStreet does not in any way guarantee that this information is free from mistakes, errors, or material misstatements. It also does not guarantee that this information is of a timely nature. Investing in Open Markets involves a great deal of risk, including the loss of all or a portion of your investment, as well as emotional distress. All risks, losses and costs associated with investing, including total loss of principal, are your responsibility. The views and opinions expressed in this article are those of the authors and do not necessarily reflect the official policy or position of FXStreet nor its advertisers. The author will not be held responsible for information that is found at the end of links posted on this page.
If not otherwise explicitly mentioned in the body of the article, at the time of writing, the author has no position in any stock mentioned in this article and no business relationship with any company mentioned. The author has not received compensation for writing this article, other than from FXStreet.
FXStreet and the author do not provide personalized recommendations. The author makes no representations as to the accuracy, completeness, or suitability of this information. FXStreet and the author will not be liable for any errors, omissions or any losses, injuries or damages arising from this information and its display or use. Errors and omissions excepted.
The author and FXStreet are not registered investment advisors and nothing in this article is intended to be investment advice.
Recommended content
Editors’ Picks
AUD/USD hovers around 0.6500 amid light trading, ahead of US GDP

AUD/USD is trading close to 0.6500 in Asian trading on Thursday, lacking a clear directional impetus amid an Anzac Day holiday in Australia. Meanwhile, traders stay cautious due ti risk-aversion and ahead of the key US Q1 GDP release.
USD/JPY finds its highest bids since 1990, near 155.50

USD/JPY keeps breaking into its highest chart territory since June of 1990 early Thursday, testing 155.50 for the first time in 34 years as the Japanese Yen remains vulnerable, despite looming Japanese intervention risks. Focus shifts to Thursday's US GDP report and the BoJ decision on Friday.
Gold price treads water near $2,320, awaits US GDP data

Gold price recovers losses but keeps its range near $2,320 early Thursday. Renewed weakness in the US Dollar and the US Treasury yields allow Gold buyers to breathe a sigh of relief. Gold price stays vulnerable amid Middle East de-escalation, awaiting US Q1 GDP data.
Injective price weakness persists despite over 5.9 million INJ tokens burned
Injective price is trading with a bearish bias, stuck in the lower section of the market range. The bearish outlook abounds despite the network's deflationary efforts to pump the price. Coupled with broader market gloom, INJ token’s doomed days may not be over yet.
Meta Platforms Earnings: META sinks 10% on lower Q2 revenue guidance Premium

This must be "opposites" week. While Doppelganger Tesla rode horrible misses on Tuesday to a double-digit rally, Meta Platforms produced impressive beats above Wall Street consensus after the close on Wednesday, only to watch the share price collapse by nearly 10%.