- Silver regains strong positive traction on Tuesday and reverses the previous day’s downfall.
- The technical set-up favours bullish traders and supports prospects for further intraday gains.
- Acceptance below the $21.00-$20.90 area is needed to negate the near-term positive outlook.
Silver shows some resilience below the $21.00 mark and regains positive traction on Tuesday, reversing a major part of the overnight slide to a four-day low. The white metal sticks to its intraday gains through the first half of the European session and is currently placed around the $21.35 region, up nearly 2% for the day.
From a technical perspective, the emergence of aggressive buying near the $20.90 static support favours bullish traders and supports prospects for additional gains. The constructive outlook is reinforced by the fact that oscillators on hourly charts have again started gaining positive traction. This, in turn, supports prospects for a further intraday appreciating move for the XAG/USD.
That said, any subsequent move up might continue to confront stiff resistance near the $21.60-$21.70 supply zone. Some follow-through buying will reaffirm the bullish bias and allow the XAG/USD to reclaim the $22.00 mark. This is followed by a five-month high, around the $22.25 zone, above which spot prices could climb to the $22.50-$22.60 area en route to the $23.00 round figure.
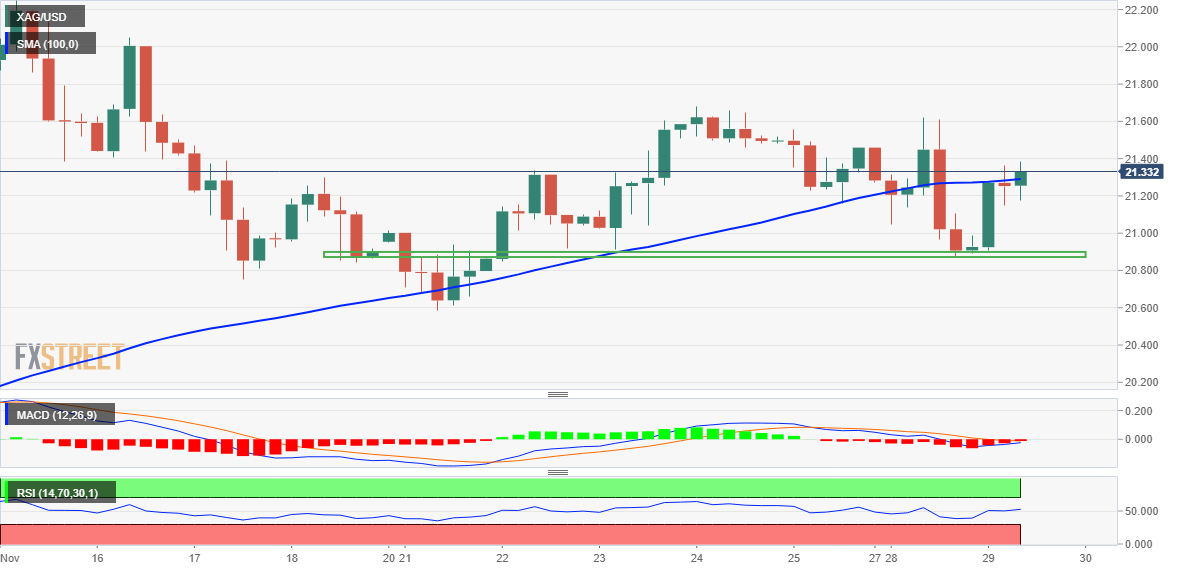
On the flip side, the $21.00-$20.90 area should continue to act as immediate strong support. A convincing break below the latter could negate the positive outlook and possibly shift the near-term bias in favour of bearish traders. The XAG/USD might then accelerate the downfall to the $20.60-$20.55 area before eventually dropping to challenge the $20.00 psychological mark.
Silver 4-hour chart
Key levels to watch
Information on these pages contains forward-looking statements that involve risks and uncertainties. Markets and instruments profiled on this page are for informational purposes only and should not in any way come across as a recommendation to buy or sell in these assets. You should do your own thorough research before making any investment decisions. FXStreet does not in any way guarantee that this information is free from mistakes, errors, or material misstatements. It also does not guarantee that this information is of a timely nature. Investing in Open Markets involves a great deal of risk, including the loss of all or a portion of your investment, as well as emotional distress. All risks, losses and costs associated with investing, including total loss of principal, are your responsibility. The views and opinions expressed in this article are those of the authors and do not necessarily reflect the official policy or position of FXStreet nor its advertisers. The author will not be held responsible for information that is found at the end of links posted on this page.
If not otherwise explicitly mentioned in the body of the article, at the time of writing, the author has no position in any stock mentioned in this article and no business relationship with any company mentioned. The author has not received compensation for writing this article, other than from FXStreet.
FXStreet and the author do not provide personalized recommendations. The author makes no representations as to the accuracy, completeness, or suitability of this information. FXStreet and the author will not be liable for any errors, omissions or any losses, injuries or damages arising from this information and its display or use. Errors and omissions excepted.
The author and FXStreet are not registered investment advisors and nothing in this article is intended to be investment advice.
Recommended content
Editors’ Picks
EUR/USD met some decent resistance above 1.0700

EUR/USD remained unable to gather extra upside traction and surpass the 1.0700 hurdle in a convincing fashion on Wednesday, instead giving away part of the weekly gains against the backdrop of a decent bounce in the Dollar.
USD/JPY refreshes 34-year high, attacks 155.00 as intervention risks loom

USD/JPY is renewing a multi-decade high, closing in on 155.00. Traders turn cautious on heightened risks of Japan's FX intervention. Broad US Dollar rebound aids the upside in the major. US Durable Goods data are next on tap.
Gold keeps consolidating ahead of US first-tier figures

Gold finds it difficult to stage a rebound midweek following Monday's sharp decline but manages to hold above $2,300. The benchmark 10-year US Treasury bond yield stays in the green above 4.6% after US data, not allowing the pair to turn north.
Bitcoin price could be primed for correction as bearish activity grows near $66K area

Bitcoin (BTC) price managed to maintain a northbound trajectory after the April 20 halving, despite bold assertions by analysts that the event would be a “sell the news” situation. However, after four days of strength, the tables could be turning as a dark cloud now hovers above BTC price.
Three fundamentals for the week: US GDP, BoJ and the Fed's favorite inflation gauge stand out Premium

While it is hard to predict when geopolitical news erupts, the level of tension is lower – allowing for key data to have its say. This week's US figures are set to shape the Federal Reserve's decision next week – and the Bank of Japan may struggle to halt the Yen's deterioration.