- NZD/USD holds on to recovery gains after upbeat New Zealand CPI ignores weaker than forecast Credit Card Spending data.
- The monthly falling trend line, 23.6% Fibonacci retracement limit immediate upside to 21-day SMA.
- 38.2% Fibonacci retracement, 200-day SMA keep sellers away.
NZD/USD stays positive while trading around 0.6615 during the early Friday. The pair showed no major response to weak Credit Card Spending from New Zealand as major attention was given to the early-day release of Q4 CPI that pleased buyers.
Following better than forecast readings of New Zealand’s fourth quarter (Q4) CPI data, December month Credit Card Spending from the nation slipped below 4.3% forecast to 3.4%.
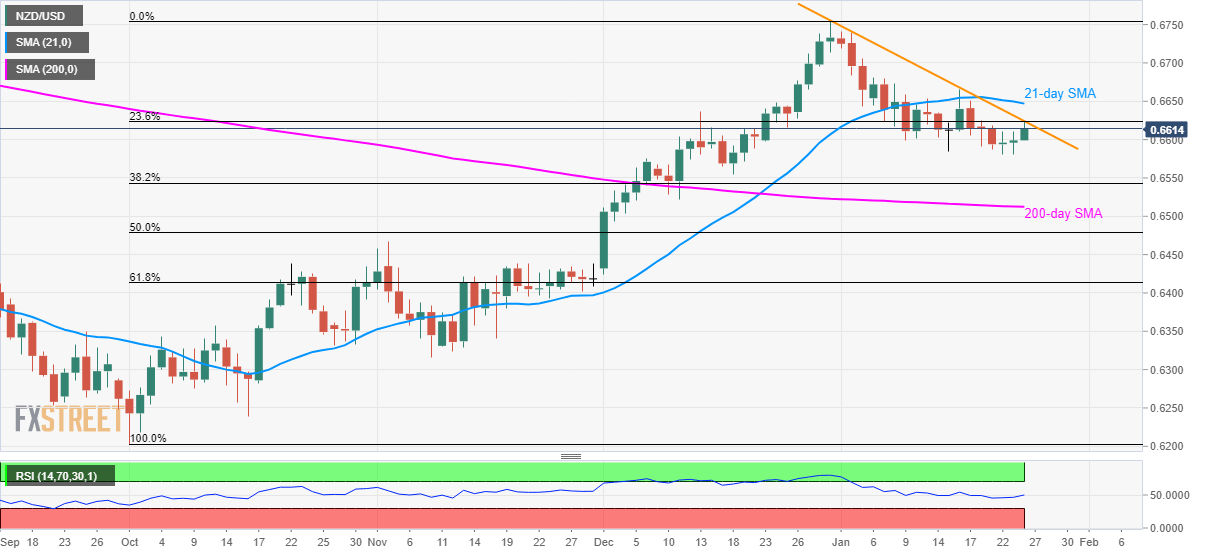
That said, the pair currently confronts short-term key resistance confluence around 0.6625 that encompasses a falling trend line since December 31 and 23.6% Fibonacci retracement of the pair’s rise from early-October to December-end.
Should NZD/USD prices manage to register a daily closing beyond 0.6625, further recovery to a 21-day SMA level near 0.6650 can’t be ruled out. Also on the bulls’ radar will be the January 16 top near 0.6665 and December 31 high of 0.6756.
Meanwhile, sellers will look for entry below the latest lows close to 0.6580. In doing so, a 38.2% Fibonacci retracement level of 0.6543 and 200-day SMA at 0.6512 now, will become their favorites.
NZD/USD daily chart
Trend: Pullback expected
Information on these pages contains forward-looking statements that involve risks and uncertainties. Markets and instruments profiled on this page are for informational purposes only and should not in any way come across as a recommendation to buy or sell in these assets. You should do your own thorough research before making any investment decisions. FXStreet does not in any way guarantee that this information is free from mistakes, errors, or material misstatements. It also does not guarantee that this information is of a timely nature. Investing in Open Markets involves a great deal of risk, including the loss of all or a portion of your investment, as well as emotional distress. All risks, losses and costs associated with investing, including total loss of principal, are your responsibility. The views and opinions expressed in this article are those of the authors and do not necessarily reflect the official policy or position of FXStreet nor its advertisers. The author will not be held responsible for information that is found at the end of links posted on this page.
If not otherwise explicitly mentioned in the body of the article, at the time of writing, the author has no position in any stock mentioned in this article and no business relationship with any company mentioned. The author has not received compensation for writing this article, other than from FXStreet.
FXStreet and the author do not provide personalized recommendations. The author makes no representations as to the accuracy, completeness, or suitability of this information. FXStreet and the author will not be liable for any errors, omissions or any losses, injuries or damages arising from this information and its display or use. Errors and omissions excepted.
The author and FXStreet are not registered investment advisors and nothing in this article is intended to be investment advice.
Recommended content
Editors’ Picks
AUD/USD failed just ahead of the 200-day SMA

Finally, AUD/USD managed to break above the 0.6500 barrier on Wednesday, extending the weekly recovery, although its advance faltered just ahead of the 0.6530 region, where the key 200-day SMA sits.
EUR/USD met some decent resistance above 1.0700

EUR/USD remained unable to gather extra upside traction and surpass the 1.0700 hurdle in a convincing fashion on Wednesday, instead giving away part of the weekly gains against the backdrop of a decent bounce in the Dollar.
Gold keeps consolidating ahead of US first-tier figures

Gold finds it difficult to stage a rebound midweek following Monday's sharp decline but manages to hold above $2,300. The benchmark 10-year US Treasury bond yield stays in the green above 4.6% after US data, not allowing the pair to turn north.
Bitcoin price could be primed for correction as bearish activity grows near $66K area

Bitcoin (BTC) price managed to maintain a northbound trajectory after the April 20 halving, despite bold assertions by analysts that the event would be a “sell the news” situation. However, after four days of strength, the tables could be turning as a dark cloud now hovers above BTC price.
Bank of Japan's predicament: The BOJ is trapped

In this special edition of TradeGATEHub Live Trading, we're joined by guest speaker Tavi @TaviCosta, who shares his insights on the Bank of Japan's current predicament, stating, 'The BOJ is Trapped.'