- The NZD/JPY is barely unchanged as the Asian session begins, though up 2.29% in the week.
- NZD/JPY Price Forecast: The pair is upwards, though RSI at overbought levels suggesting a correction is on the cards.
NZD/JPY is subdued around 81.60 early in the Asian Pacific session on Friday, after rising for three consecutive days, so far in the week, reaching a YTD high around 81.73, the highest level since November 2021.
Overnight, the NZD/JPY pair braced to the 81.00 area, though later it reached a daily high near 81.44, subsequently followed by a drop around 81.00, a solid demand area, which pushed the pair towards 81.73 year-to-date high.
NZD/JPY Price Forecast: Technical outlook
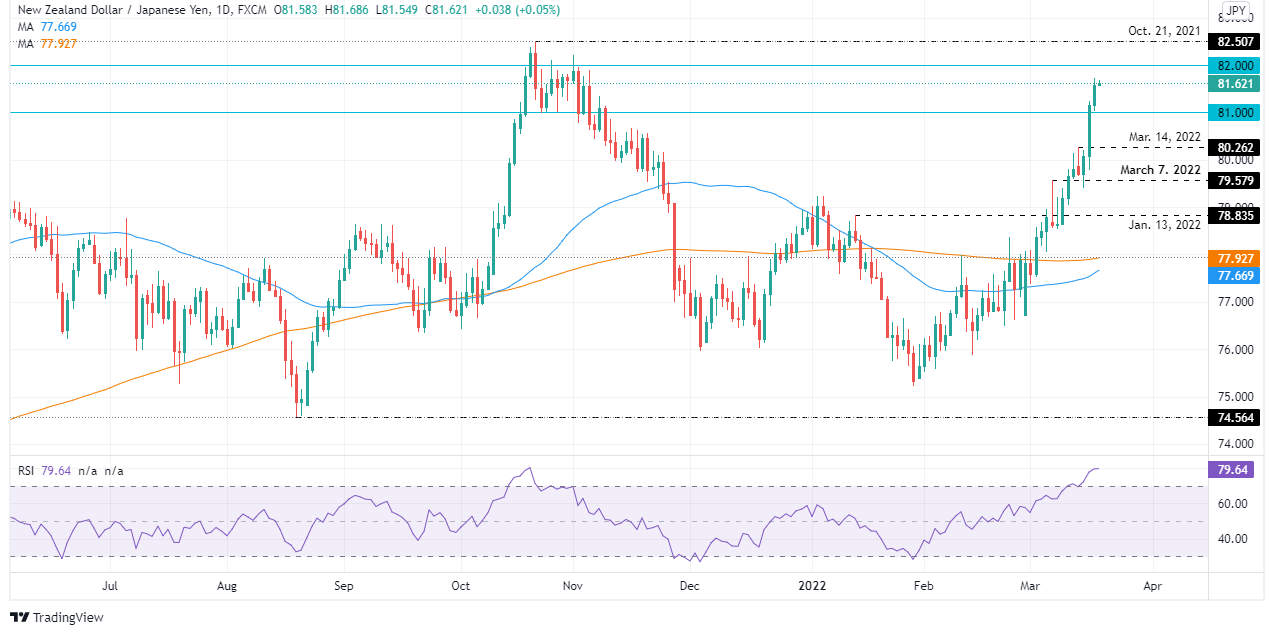
The NZD/JPY remains upward biased, despite being a barometer for risk sentiment trades. Daily moving averages (DMAs), although almost horizontal, begin to aim higher, led by the 50-DMA at 77.66, which is about to cross over the 200-DMA at 77.92, forming a golden cross a signal of bullish strength.
However, the Relative Strenght Index (RSI), a momentum oscillator, sits near the 80 reading in the overbought zone, meaning a reversion move is on the cards, so the pair might correct lower before resuming the ongoing uptrend.
If that scenario plays out, the NZD/JPY first support level would be the 81.00 mark, followed by the March 14 daily high previous resistance-now-support at 80.26.
Upwards, the NZD/JPY first resistance would be 82.00. Breach of the latter would expose the 2021 yearly high at 82.50, followed by the 83.00 mark.
Information on these pages contains forward-looking statements that involve risks and uncertainties. Markets and instruments profiled on this page are for informational purposes only and should not in any way come across as a recommendation to buy or sell in these assets. You should do your own thorough research before making any investment decisions. FXStreet does not in any way guarantee that this information is free from mistakes, errors, or material misstatements. It also does not guarantee that this information is of a timely nature. Investing in Open Markets involves a great deal of risk, including the loss of all or a portion of your investment, as well as emotional distress. All risks, losses and costs associated with investing, including total loss of principal, are your responsibility. The views and opinions expressed in this article are those of the authors and do not necessarily reflect the official policy or position of FXStreet nor its advertisers. The author will not be held responsible for information that is found at the end of links posted on this page.
If not otherwise explicitly mentioned in the body of the article, at the time of writing, the author has no position in any stock mentioned in this article and no business relationship with any company mentioned. The author has not received compensation for writing this article, other than from FXStreet.
FXStreet and the author do not provide personalized recommendations. The author makes no representations as to the accuracy, completeness, or suitability of this information. FXStreet and the author will not be liable for any errors, omissions or any losses, injuries or damages arising from this information and its display or use. Errors and omissions excepted.
The author and FXStreet are not registered investment advisors and nothing in this article is intended to be investment advice.
Recommended content
Editors’ Picks
EUR/USD clings to daily gains above 1.0650

EUR/USD gained traction and turned positive on the day above 1.0650. The improvement seen in risk mood following the earlier flight to safety weighs on the US Dollar ahead of the weekend and helps the pair push higher.
GBP/USD recovers toward 1.2450 after UK Retail Sales data

GBP/USD reversed its direction and advanced to the 1.2450 area after touching a fresh multi-month low below 1.2400 in the Asian session. The positive shift seen in risk mood on easing fears over a deepening Iran-Israel conflict supports the pair.
Gold holds steady at around $2,380 following earlier spike

Gold stabilized near $2,380 after spiking above $2,400 with the immediate reaction to reports of Israel striking Iran. Meanwhile, the pullback seen in the US Treasury bond yields helps XAU/USD hold its ground.
Bitcoin Weekly Forecast: BTC post-halving rally could be partially priced in Premium

Bitcoin price shows no signs of directional bias while it holds above $60,000. The fourth BTC halving is partially priced in, according to Deutsche Bank’s research.
Week ahead – US GDP and BoJ decision on top of next week’s agenda

US GDP, core PCE and PMIs the next tests for the Dollar. Investors await BoJ for guidance about next rate hike. EU and UK PMIs, as well as Australian CPIs also on tap.