- The NZD/JPY March rally has gained 8.48% in the month.
- NZD/JPY Price Forecast: A breach of the 85.00 mark would expose levels not seen since July 2015.
The New Zealand dollar extended its rally vs. the Japanese yen for the second time in the week, despite a downbeat market mood courtesy of tensions in Eastern Europe. As the Asian Pacific session is about to kick in, the NZD/JPY trades at 84.43 at the time of writing.
US equities finished Wall Street’s trading session with losses. In the meantime, the greenback traded firmly, as portrayed by the US Dollar Index rising 0.20% at 98.612, while the US Treasuries sell-off stalled, with yields down.
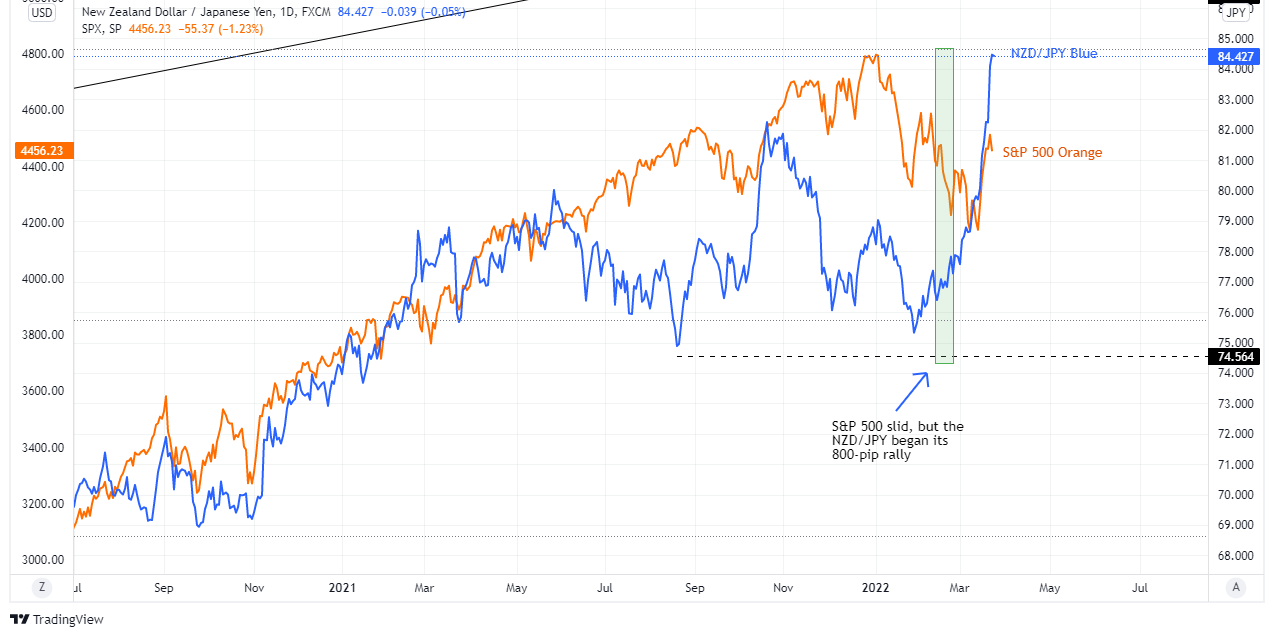
The NZD/JPY pair is a cross-currency pair traded mainly as pure market sentiment play. However, it appears to be decoupled from a positive correlation with the S&P 500. Since mid-February of 2022, the S&P 500 began sliding, as the US central bank turned hawkish, while the NZD/JPY began its 800 pip rally, from around 76.00 towards 84.00
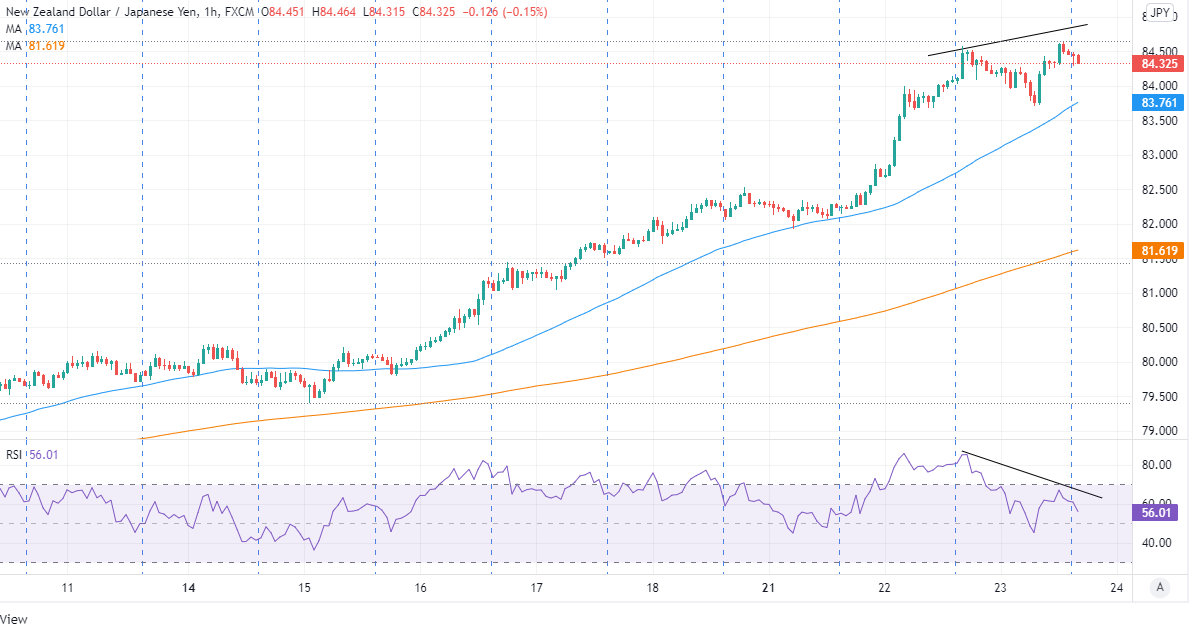
Overnight, the NZD/JPY began on a higher note, around 84.00-30, reaching a daily low at 83.70. Late in the New York session, staged a rebound achieving a YTD high at 84.64, despite the negative divergence between NZD/JPY’s price action and the Relative Strength Index (RSI), a momentum indicator in the 1-hour chart.
NZD/JPY Price Forecast: Technical outlook
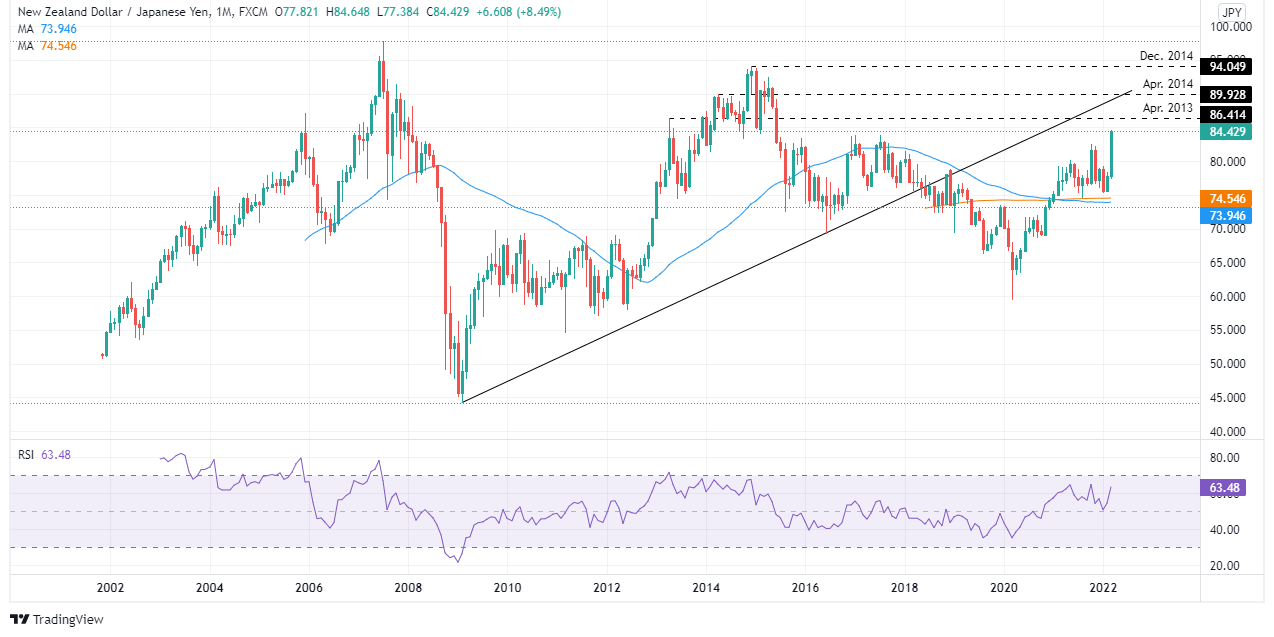
The NZD/JPY daily chart depicts the pair as upward biased. Furthermore, the 50-day moving average (DMA) at 78.12 just crossed over the 200-DMA at 78.04, forming a golden cross, which means the NZD/JPY is ready to make new highs unless a sudden market sentiment increases appetite for safe-haven peers.
With that said, the NZD/JPY’s first resistance would be the 85.00 mark. A breach of the latter would expose the April 2013 high at 86.41, followed by April 2014 at 89.92, and the 90.00 mark.
Information on these pages contains forward-looking statements that involve risks and uncertainties. Markets and instruments profiled on this page are for informational purposes only and should not in any way come across as a recommendation to buy or sell in these assets. You should do your own thorough research before making any investment decisions. FXStreet does not in any way guarantee that this information is free from mistakes, errors, or material misstatements. It also does not guarantee that this information is of a timely nature. Investing in Open Markets involves a great deal of risk, including the loss of all or a portion of your investment, as well as emotional distress. All risks, losses and costs associated with investing, including total loss of principal, are your responsibility. The views and opinions expressed in this article are those of the authors and do not necessarily reflect the official policy or position of FXStreet nor its advertisers. The author will not be held responsible for information that is found at the end of links posted on this page.
If not otherwise explicitly mentioned in the body of the article, at the time of writing, the author has no position in any stock mentioned in this article and no business relationship with any company mentioned. The author has not received compensation for writing this article, other than from FXStreet.
FXStreet and the author do not provide personalized recommendations. The author makes no representations as to the accuracy, completeness, or suitability of this information. FXStreet and the author will not be liable for any errors, omissions or any losses, injuries or damages arising from this information and its display or use. Errors and omissions excepted.
The author and FXStreet are not registered investment advisors and nothing in this article is intended to be investment advice.
Recommended content
Editors’ Picks
AUD/USD posts gain, yet dive below 0.6500 amid Aussie CPI, ahead of US GDP

The Aussie Dollar finished Wednesday’s session with decent gains of 0.15% against the US Dollar, yet it retreated from weekly highs of 0.6529, which it hit after a hotter-than-expected inflation report. As the Asian session begins, the AUD/USD trades around 0.6495.
USD/JPY finds its highest bids since 1990, approaches 156.00

USD/JPY broke into its highest chart territory since June of 1990 on Wednesday, peaking near 155.40 for the first time in 34 years as the Japanese Yen continues to tumble across the broad FX market.
Gold stays firm amid higher US yields as traders await US GDP data

Gold recovers from recent losses, buoyed by market interest despite a stronger US Dollar and higher US Treasury yields. De-escalation of Middle East tensions contributed to increased market stability, denting the appetite for Gold buying.
Ethereum suffers slight pullback, Hong Kong spot ETH ETFs to begin trading on April 30

Ethereum suffered a brief decline on Wednesday afternoon despite increased accumulation from whales. This follows Ethereum restaking protocol Renzo restaked ETH crashing from its 1:1 peg with ETH and increased activities surrounding spot Ethereum ETFs.
Dow Jones Industrial Average hesitates on Wednesday as markets wait for key US data

The DJIA stumbled on Wednesday, falling from recent highs near 38,550.00 as investors ease off of Tuesday’s risk appetite. The index recovered as US data continues to vex financial markets that remain overwhelmingly focused on rate cuts from the US Fed.