Gold bullish bounce at 38.2% fib but uptrend pauzes
This article reviews the potential for Gold to move up. We also analyse the targets in the short-term and long-term.
The XAU/USD uptrend saw price breaking above the round $2,000 level in the 1st half of 2020. But the 2nd half of 2020 has been a lot quieter. Let’s review why.The current pause within the uptrend is turning into a significant pullback, which is typical for a wave 4 (purple) pattern. Read more...

Gold Price Analysis: XAU/USD challenges key $1795 hurdle on the road to recovery
Gold (XAU/USD) is struggling to extend its recovery from seven-month lows in early Europe, as the two-week-old falling trendline resistance at $1795 on the hourly chart tests the bulls’ commitment.
However, the bull cross, with the 21-hourly moving average (HMA) having crossed the 50-HMA from below, favors the further upside. Alternatively, the 100-HMA could now offer immediate support, below which the 21-HMA at $1783 could come to the buyers ‘rescue. Read more...
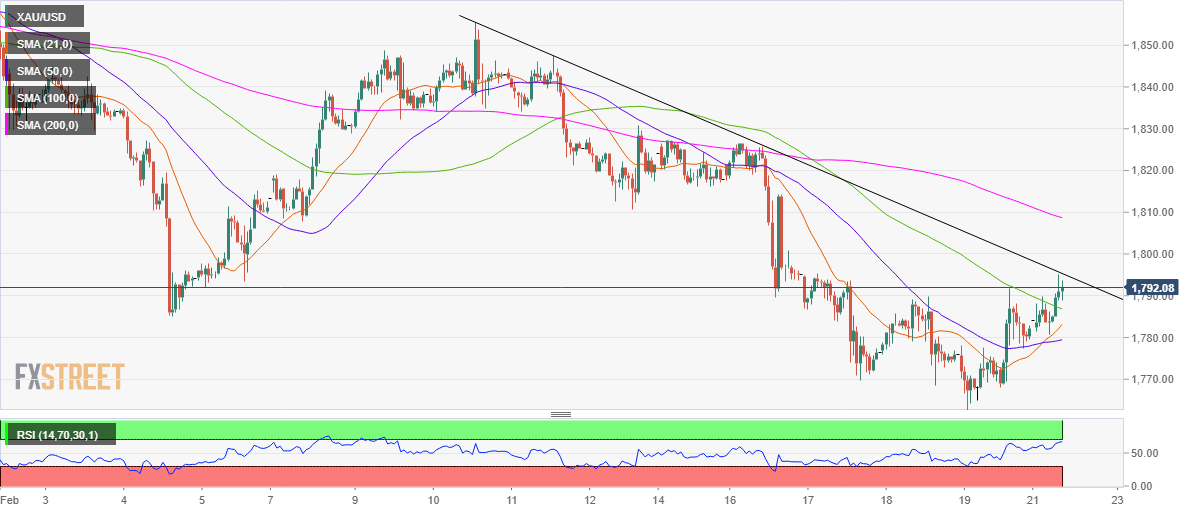
Gold price analysis: XAU/USD short-term increases but keeps downtrend in the long-term
Gold continues moving around the price of $1780/oz - $1785/oz. This action shows the cautiousness of investors in the economic recovery and the excessive increase of Bitcoin. In the London session and New York session today, the moving will lead gold trendline in the next 3 days.
The DXY - US Dollar Index, moving around 90.3 - 90.5. Similar to Gold, the DXY is in an retesting uptrend after a dropping on 17th February, under the impact of the economic stimulus package of $1,900 billion, that was just approved last week. Read more...

Information on these pages contains forward-looking statements that involve risks and uncertainties. Markets and instruments profiled on this page are for informational purposes only and should not in any way come across as a recommendation to buy or sell in these assets. You should do your own thorough research before making any investment decisions. FXStreet does not in any way guarantee that this information is free from mistakes, errors, or material misstatements. It also does not guarantee that this information is of a timely nature. Investing in Open Markets involves a great deal of risk, including the loss of all or a portion of your investment, as well as emotional distress. All risks, losses and costs associated with investing, including total loss of principal, are your responsibility. The views and opinions expressed in this article are those of the authors and do not necessarily reflect the official policy or position of FXStreet nor its advertisers. The author will not be held responsible for information that is found at the end of links posted on this page.
If not otherwise explicitly mentioned in the body of the article, at the time of writing, the author has no position in any stock mentioned in this article and no business relationship with any company mentioned. The author has not received compensation for writing this article, other than from FXStreet.
FXStreet and the author do not provide personalized recommendations. The author makes no representations as to the accuracy, completeness, or suitability of this information. FXStreet and the author will not be liable for any errors, omissions or any losses, injuries or damages arising from this information and its display or use. Errors and omissions excepted.
The author and FXStreet are not registered investment advisors and nothing in this article is intended to be investment advice.
Recommended content
Editors’ Picks
EUR/USD clings to daily gains above 1.0650

EUR/USD gained traction and turned positive on the day above 1.0650. The improvement seen in risk mood following the earlier flight to safety weighs on the US Dollar ahead of the weekend and helps the pair push higher.
GBP/USD recovers toward 1.2450 after UK Retail Sales data

GBP/USD reversed its direction and advanced to the 1.2450 area after touching a fresh multi-month low below 1.2400 in the Asian session. The positive shift seen in risk mood on easing fears over a deepening Iran-Israel conflict supports the pair.
Gold holds steady at around $2,380 following earlier spike

Gold stabilized near $2,380 after spiking above $2,400 with the immediate reaction to reports of Israel striking Iran. Meanwhile, the pullback seen in the US Treasury bond yields helps XAU/USD hold its ground.
Bitcoin Weekly Forecast: BTC post-halving rally could be partially priced in Premium

Bitcoin price shows no signs of directional bias while it holds above $60,000. The fourth BTC halving is partially priced in, according to Deutsche Bank’s research.
Week ahead – US GDP and BoJ decision on top of next week’s agenda

US GDP, core PCE and PMIs the next tests for the Dollar. Investors await BoJ for guidance about next rate hike. EU and UK PMIs, as well as Australian CPIs also on tap.