- Gold price takes offers to refresh intraday low, pares the biggest daily gain in a week amid volatile session.
- BoJ inaction fails to tame market’s fears amid inflation concerns.
- Geopolitical woes, US Dollar’s rebound from intraday low also weigh on XAU/USD price.
- Key central bank announcements, US employment data for February will be the key for fresh impulse.
Gold price (XAU/USD) remains pressured around the intraday bottom near $1,828 as markets brace for the US jobs report, after witnessing a haywire move on the Bank of Japan’s inaction, during early Friday. It’s worth noting that the precious metal’s latest weakness appears more linked to the risk-off mood than to the US Treasury bond yield and the US Dollar as both these catalysts are in the red zone, despite bouncing off recently.
While talking about the sentiment, BoJ highlights inflation fears and joins the New York Fed to challenge the policy doves, suggesting more rate hikes and question the economic growth, which in turn tease Gold sellers.
That said, the BoJ keeps the short-term interest rate target at -0.1% while directing 10-year Japanese Government Bond (JGB) yields within the band of +/-0.50%.
On the other hand, New York Fed mentioned, in its latest report, that recent upward revisions to inflation data coupled with higher-than-expected levels of inflation had changed the picture of what had appeared to be cooling in price pressures.
It should be observed that the previous day’s mixed signals of the US employment data allowed the US Dollar to remain weak, which in turn seemed to have put a floor under the Gold price.
Also positive for the Gold price could be a news piece from Bloomberg suggesting that China’s consumer spending is showing signs of a strong rebound joining the hopes of more stimulus from the dragon nation and the US readiness for more spending.
However, the latest risk-off mood and cautious sentiment ahead of the Nonfarm Payrolls (NFP) join the geopolitical fears to weigh on sentiment. Among them, US President Joe Biden’s budget proposal for 2024 and the US partnership with the UK and Australia for nuclear submarines weigh on the risk appetite and the XAU/USD.
Looking ahead, the US jobs report for February will be observed closely as traders have recently curtailed the market’s bets on the 50 bps rate hike in March.
Also read: Nonfarm Payrolls Preview: Five scenarios for the Fed, USD and stocks reactions, with probabilities
Gold price technical analysis
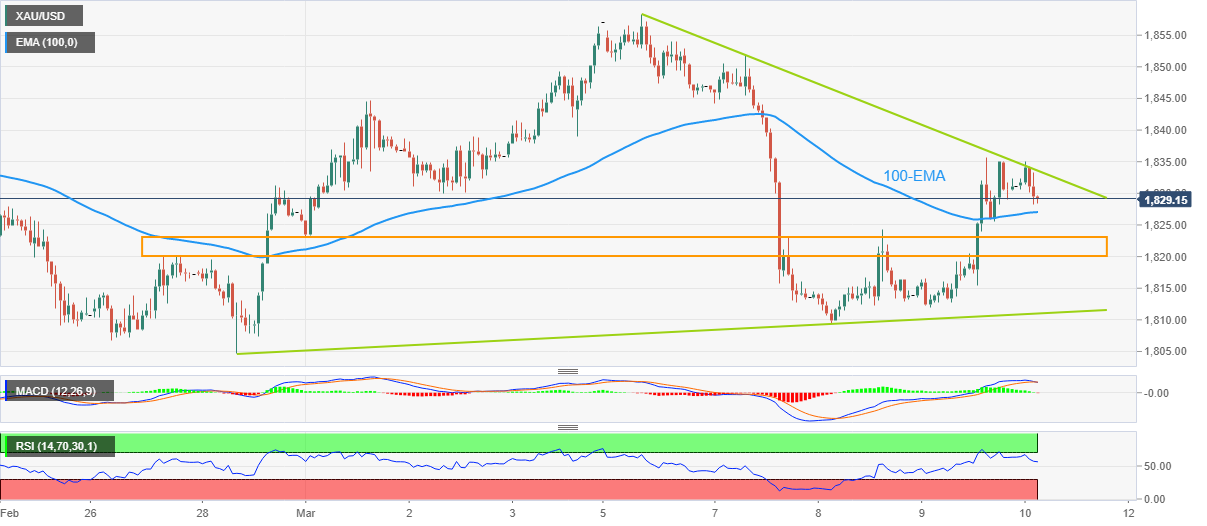
Gold price slides within a one-week-old symmetrical triangle, recently easing from the resistance line amid an impending bear cross on the MACD. It’s worth noting that the RSI’s retreat from the overbought territory also exerts downside pressure on the XAU/USD price that aims for the 100-bar Exponential Moving Average (EMA), around $1,827 at the latest.
However, a broad support area between $1,820 and $1,823, comprising multiple levels marked since late February, appears a tough nut to crack for the Gold sellers afterward.
Should the XAU/USD price remains weak past $1,820, an upward-sloping support line from February, forming part of the aforementioned triangle, could act as the last defense of the Gold buyers near $1,810.
Meanwhile, an upside clearance of the stated triangle’s top line, close to $1,835 at the latest, could propel the Gold price towards the month-start peak surrounding $1,845. Following that, the monthly high of nearly $1,859 will be in the spotlight.
Overall, Gold price signals further downside but the room towards the south appears limited.
Gold price: Hourly chart
Trend: Further downside expected
Information on these pages contains forward-looking statements that involve risks and uncertainties. Markets and instruments profiled on this page are for informational purposes only and should not in any way come across as a recommendation to buy or sell in these assets. You should do your own thorough research before making any investment decisions. FXStreet does not in any way guarantee that this information is free from mistakes, errors, or material misstatements. It also does not guarantee that this information is of a timely nature. Investing in Open Markets involves a great deal of risk, including the loss of all or a portion of your investment, as well as emotional distress. All risks, losses and costs associated with investing, including total loss of principal, are your responsibility. The views and opinions expressed in this article are those of the authors and do not necessarily reflect the official policy or position of FXStreet nor its advertisers. The author will not be held responsible for information that is found at the end of links posted on this page.
If not otherwise explicitly mentioned in the body of the article, at the time of writing, the author has no position in any stock mentioned in this article and no business relationship with any company mentioned. The author has not received compensation for writing this article, other than from FXStreet.
FXStreet and the author do not provide personalized recommendations. The author makes no representations as to the accuracy, completeness, or suitability of this information. FXStreet and the author will not be liable for any errors, omissions or any losses, injuries or damages arising from this information and its display or use. Errors and omissions excepted.
The author and FXStreet are not registered investment advisors and nothing in this article is intended to be investment advice.
Recommended content
Editors’ Picks
EUR/USD climbs to 10-day highs above 1.0700

EUR/USD gained traction and rose to its highest level in over a week above 1.0700 in the American session on Tuesday. The renewed US Dollar weakness following the disappointing PMI data helps the pair stretch higher.
GBP/USD extends recovery beyond 1.2400 on broad USD weakness

GBP/USD gathered bullish momentum and extended its daily rebound toward 1.2450 in the second half of the day. The US Dollar came under heavy selling pressure after weaker-than-forecast PMI data and fueled the pair's rally.
Gold rebounds to $2,320 as US yields turn south

Gold reversed its direction and rose to the $2,320 area, erasing a large portion of its daily losses in the process. The benchmark 10-year US Treasury bond yield stays in the red below 4.6% following the weak US PMI data and supports XAU/USD.
Here’s why Ondo price hit new ATH amid bearish market outlook Premium

Ondo price shows no signs of slowing down after setting up an all-time high (ATH) at $1.05 on March 31. This development is likely to be followed by a correction and ATH but not necessarily in that order.
Germany’s economic come back

Germany is the sick man of Europe no more. Thanks to its service sector, it now appears that it will exit recession, and the economic future could be bright. The PMI data for April surprised on the upside for Germany, led by the service sector.