- Gold price consolidates the two-day recovery, as the US yield curve flattens.
- All eyes on Thursday’s critical ECB and US GDP data for the next big move in gold.
- Gold bears and bulls fight over $1,800, focus shifts to US GDP.
Spiking short-term US Treasury yields amid increasing bets of Fed’s monetary policy normalization, in the face of strengthening economic recovery, leading to the flattening of the yield curve. As the yield curve flattens, it also re-ignites stagflation fears amid the persistence of rising price pressures globally, which is possibly keeping the buoyant tone intact around the traditional safe-haven gold price. However, gold bulls remain cautious and refrain from placing any fresh bets ahead of the key event risks for this week.
Read: Gold Price Forecast: Risks appear skewed to the upside for XAU/USD heading into ECB, US GDP
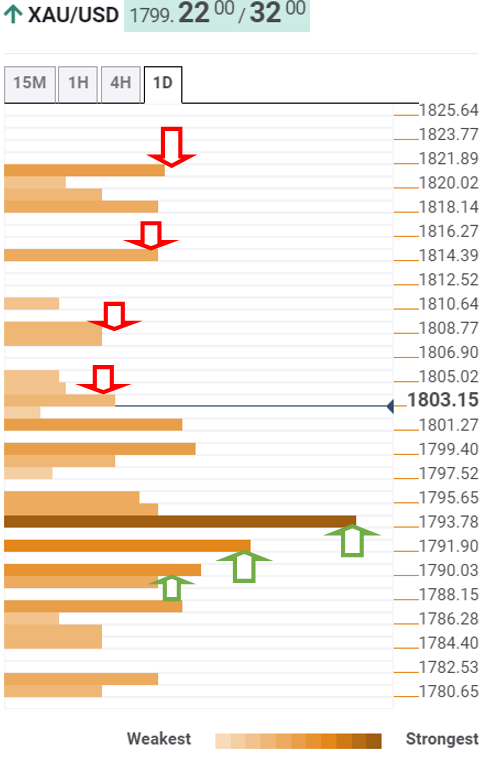
Gold Price: Key levels to watch
The Technical Confluences Detector shows that gold is retreating after having faced rejection at $1804, the previous high four-hour.
At the press time, gold price is battling $1800, the confluence of the previous day’s high and the SMA5 four-hour.
If the selling pressure intensifies, the next relevant support is seen around $1793, where the SMA200, Fibonacci 38.2% one-day and one-week merge.
Further south, the Fibonacci 61.8% one-month at $1791 will play out, below which the convergence of the SMA100 one-day and Fibonacci 61.8% one-day at $1789 will be challenged.
On the upside, gold buyers will need acceptance above the aforesaid $1804 resistance level. The buyers will then target the pivot point one-day R2 at $1809.
Fresh buying opportunities above the latter will seek a test of the previous week’s high of $1814.
Further up, the bulls will then challenge a dense cluster of resistance levels around $1820, which is the intersection of the pivot point one-day R3, pivot point one-month R1 and pivot point one-week R1.
Here is how it looks on the tool
About Technical Confluences Detector
The TCD (Technical Confluences Detector) is a tool to locate and point out those price levels where there is a congestion of indicators, moving averages, Fibonacci levels, Pivot Points, etc. If you are a short-term trader, you will find entry points for counter-trend strategies and hunt a few points at a time. If you are a medium-to-long-term trader, this tool will allow you to know in advance the price levels where a medium-to-long-term trend may stop and rest, where to unwind positions, or where to increase your position size.
Information on these pages contains forward-looking statements that involve risks and uncertainties. Markets and instruments profiled on this page are for informational purposes only and should not in any way come across as a recommendation to buy or sell in these assets. You should do your own thorough research before making any investment decisions. FXStreet does not in any way guarantee that this information is free from mistakes, errors, or material misstatements. It also does not guarantee that this information is of a timely nature. Investing in Open Markets involves a great deal of risk, including the loss of all or a portion of your investment, as well as emotional distress. All risks, losses and costs associated with investing, including total loss of principal, are your responsibility. The views and opinions expressed in this article are those of the authors and do not necessarily reflect the official policy or position of FXStreet nor its advertisers. The author will not be held responsible for information that is found at the end of links posted on this page.
If not otherwise explicitly mentioned in the body of the article, at the time of writing, the author has no position in any stock mentioned in this article and no business relationship with any company mentioned. The author has not received compensation for writing this article, other than from FXStreet.
FXStreet and the author do not provide personalized recommendations. The author makes no representations as to the accuracy, completeness, or suitability of this information. FXStreet and the author will not be liable for any errors, omissions or any losses, injuries or damages arising from this information and its display or use. Errors and omissions excepted.
The author and FXStreet are not registered investment advisors and nothing in this article is intended to be investment advice.
Recommended content
Editors’ Picks
EUR/USD retreats below 1.0700 after US GDP data

EUR/USD came under modest bearish pressure and retreated below 1.0700. Although the US data showed that the economy grew at a softer pace than expected in Q1, strong inflation-related details provided a boost to the USD.
GBP/USD declines below 1.2500 as USD rebounds

GBP/USD declined below 1.2500 and erased the majority of its daily gains with the immediate reaction to the US GDP report. The US economy expanded at a softer pace than expected in Q1 but the price deflator jumped to 3.4% from 1.8%.
Gold drops below $2,320 as US yields shoot higher

Gold lost its traction and turned negative on the day below $2,320 in the American session on Thursday. The benchmark 10-year US Treasury bond yield is up more than 1% on the day above 4.7% after US GDP report, weighing on XAU/USD.
XRP extends its decline, crypto experts comment on Ripple stablecoin and benefits for XRP Ledger

Ripple extends decline to $0.52 on Thursday, wipes out weekly gains. Crypto expert asks Ripple CTO how the stablecoin will benefit the XRP Ledger and native token XRP.
After the US close, it’s the Tokyo CPI

After the US close, it’s the Tokyo CPI, a reliable indicator of the national number and then the BoJ policy announcement. Tokyo CPI ex food and energy in Japan was a rise to 2.90% in March from 2.50%.