- Gold prints a corrective pullback from a three-week low.
- Yields pause previous declines, US stock futures print mild gains but Asia-Pacific equities trade mixed.
- Firmer US data, inflation expectations keep gold bears hopeful before Fed’s preferred inflation gauge, India gold demand tests sellers.
- Gold Price Forecast: Poised to challenge January’s low at 1,782.60
Update: Gold (XAU/USD) prices grind higher during the first positive day in three, up 0.22% intraday near $1,799 at the latest.
In doing so, the precious metal licks its wounds during early Friday, after declining almost $50.00 following the US Federal Reserve’s (Fed) hawkish halt.
The corrective pullback tracks firmer US stock futures while also cheering a pullback in the US Dollar Index (DXY) from the highest levels last seen during July 2020.
That said, mixed clues on the Russia-Ukraine story and the market’s consolidation ahead of the Fed’s preferred inflation gauge seem to underpin the latest recovery of gold prices.
It should be noted, however, that the expected strength in the US Core PCE Price Index for December, to 4.8% YoY versus 4.7% prior, could help the US dollar bulls to retake controls and exert downside pressure on the gold prices. Additionally, GDP figures from Germany and the US Employment Cost Index may also entertain gold traders.
Other than the data, updates on Russia’s readiness for a war with Ukraine and the western ability to tame the war fears will also be important to watch for predicting gold prices.
End of update.
Gold (XAU/USD) licks the Fed-led wounds of around $1,797-98, up 0.15% intraday during Friday’s Asian session. In doing so, the yellow metal reacts to the upbeat demand forecasts for the world’s top gold consumer, as well as mildly bid US equity futures, amid a sluggish session.
The bright metal refreshed a three-week low the previous day as markets cheered the US Federal Reserve’s (Fed) signals of the March rate hike and room for more lift-offs. That said, the hawkish Fed hints offered a $50.00 slump in the gold prices before the latest bounce from $1,791.
Gold prices portray a corrective pullback as demand from the world’s second-largest gold consumer India is likely to increase, per the World Gold Council (WGC) report shared by Reuters. “India's gold consumption is expected to rise further in 2022 after jumping 79% last year as pent-up demand and an improvement in consumer confidence are seen boosting retail jewelry sales,” the news said.
Indian demand has averaged 769.7 tonnes over the last 10 years and is expected to jump to the highest levels in six years, per regional CEO of WGC India, to around 800-850 tonnes versus 797.3 tonnes last year.
On a different page, markets digest Fed-led wounds amid a light calendar day in Asia, which in turn allows equities and other riskier assets like gold to consolidate the latest losses. Additionally, mixed concerns over the Russia-Ukraine tussles and cautious mood ahead of the Fed’s preferred inflation gauge also help gold prices to print a corrective pullback.
Read: US President Biden eyes additional macroeconomic help for Ukraine as Russian invasion looms
Amid these plays, the US 10-year Treasury yields stay firmer around 1.81% while the S&P 500 Futures rise half a percent by the press time. Additionally, the Asia-Pacific equities traded mixed while the US Dollar Index (DXY) struggles for a clear direction after rising to the highest levels since July 2020 the previous day.
Looking forward, the gold traders may now await the US Core PCE Price Index figures for December as they’re considered the Fed’s preferred version of inflation. Markets expect a 4.8% YoY figure versus 4.7% prior. Also important will be updates over the likely Russian invasion of Ukraine.
Read: US PCE Inflation Preview: Dollar rally has more legs to run
Technical analysis
Be it a clear downside break of $1,810 support confluence on 4H or the 200-DMA level of $1,805, gold selling is in full steam.
However, oversold RSI conditions on the four-hour chart (4H) triggered the metals latest rebound from $1,791 support level comprising 61.8% Fibonacci retracement of December-January upside.
Also acting as immediate support is the area comprising multiple levels marked since late December, near $1,785.
Following that, a slump to $1,770 and the last month’s bottom surrounding $1,753 can’t be ruled out.
Gold: Four-hour chart
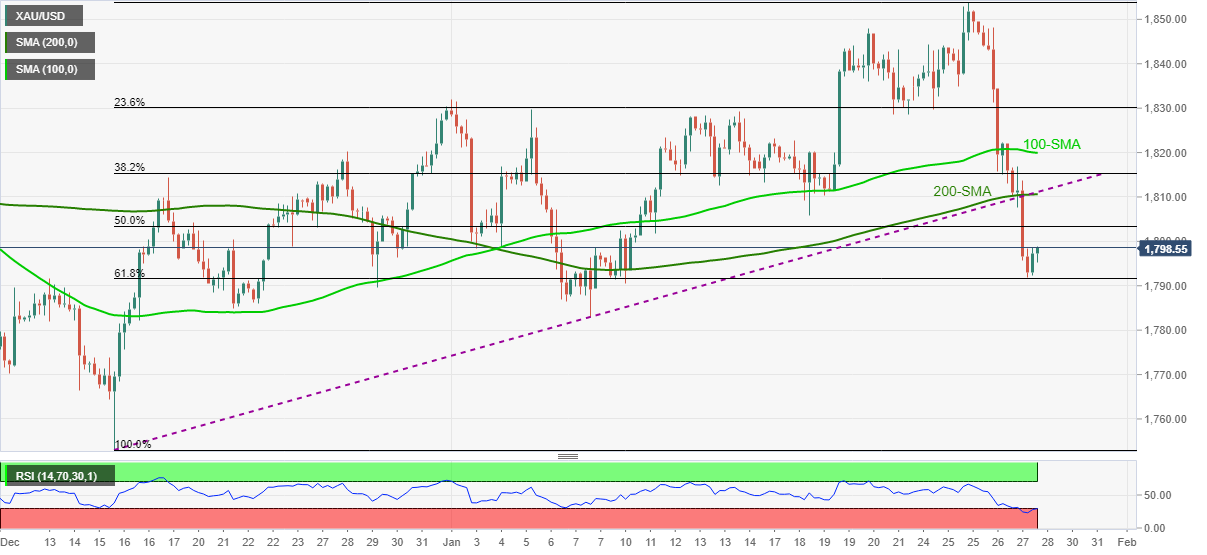
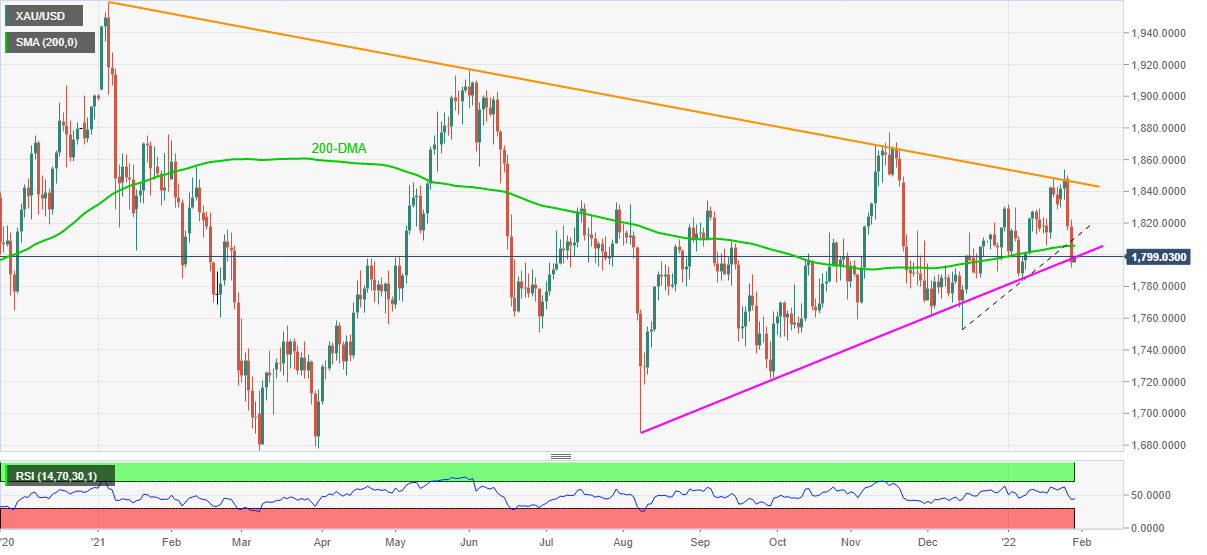
It’s worth noting that the daily chart shows a notable downside gap as the quote recently conquered an upward sloping support line from August, now resistance around $1,800.
Gold: Daily chart
Alternatively, a clear upside break of $1,810 will need validation from $1,831 to recall gold buyers.
Even so, the yearly resistance line and the monthly peak, respectively around $1,847 and $1,853 will be tough nuts to crack for the gold bulls.
Information on these pages contains forward-looking statements that involve risks and uncertainties. Markets and instruments profiled on this page are for informational purposes only and should not in any way come across as a recommendation to buy or sell in these assets. You should do your own thorough research before making any investment decisions. FXStreet does not in any way guarantee that this information is free from mistakes, errors, or material misstatements. It also does not guarantee that this information is of a timely nature. Investing in Open Markets involves a great deal of risk, including the loss of all or a portion of your investment, as well as emotional distress. All risks, losses and costs associated with investing, including total loss of principal, are your responsibility. The views and opinions expressed in this article are those of the authors and do not necessarily reflect the official policy or position of FXStreet nor its advertisers. The author will not be held responsible for information that is found at the end of links posted on this page.
If not otherwise explicitly mentioned in the body of the article, at the time of writing, the author has no position in any stock mentioned in this article and no business relationship with any company mentioned. The author has not received compensation for writing this article, other than from FXStreet.
FXStreet and the author do not provide personalized recommendations. The author makes no representations as to the accuracy, completeness, or suitability of this information. FXStreet and the author will not be liable for any errors, omissions or any losses, injuries or damages arising from this information and its display or use. Errors and omissions excepted.
The author and FXStreet are not registered investment advisors and nothing in this article is intended to be investment advice.
Recommended content
Editors’ Picks
AUD/USD could extend the recovery to 0.6500 and above

The enhanced risk appetite and the weakening of the Greenback enabled AUD/USD to build on the promising start to the week and trade closer to the key barrier at 0.6500 the figure ahead of key inflation figures in Australia.
EUR/USD now refocuses on the 200-day SMA

EUR/USD extended its positive momentum and rose above the 1.0700 yardstick, driven by the intense PMI-led retracement in the US Dollar as well as a prevailing risk-friendly environment in the FX universe.
Gold struggles around $2,325 despite broad US Dollar’s weakness

Gold reversed its direction and rose to the $2,320 area, erasing a large portion of its daily losses in the process. The benchmark 10-year US Treasury bond yield stays in the red below 4.6% following the weak US PMI data and supports XAU/USD.
Bitcoin price makes run for previous cycle highs as Morgan Stanley pushes BTC ETF exposure

Bitcoin (BTC) price strength continues to grow, three days after the fourth halving. Optimism continues to abound in the market as Bitcoiners envision a reclamation of previous cycle highs.
US versus the Eurozone: Inflation divergence causes monetary desynchronization

Historically there is a very close correlation between changes in US Treasury yields and German Bund yields. This is relevant at the current juncture, considering that the recent hawkish twist in the tone of the Federal Reserve might continue to push US long-term interest rates higher and put upward pressure on bond yields in the Eurozone.