- Gold prices snap two-day downtrend as 200-DMA limits short-term fall.
- Downbeat US data, mixed sentiment underpin US dollar weakness ahead of Fed’s preferred inflation gauge.
- Monthly resistance lures buyers but geopolitical, covid headlines test upside momentum.
- Gold dropped as expected & rebound in progress
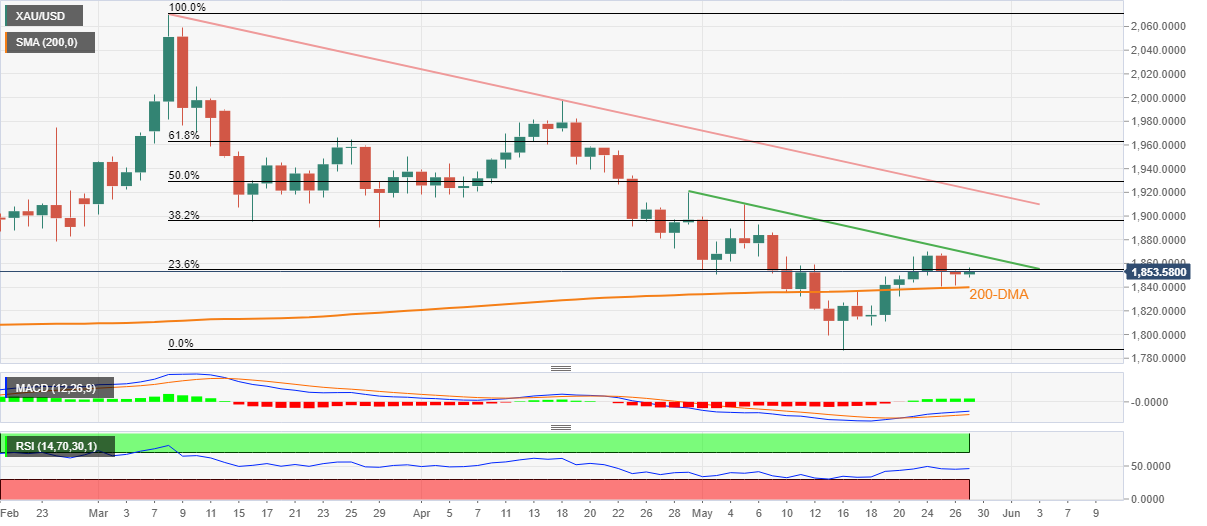
Gold Price (XAU/USD) marks another bounce off the 200-DMA as bulls flirt with the $1,855 during Friday’s Asian session. In doing so, the bullion prices print the first daily gains in three while bracing for the key upside hurdle.
The yellow metal cheers the broad US dollar weakness amid the market’s indecision. However, the metal’s gains seem to be challenged by the cautious mood ahead of the US Federal Reserve (Fed) preferred inflation gauge, namely the US Core Personal Consumption Expenditure (PCE) Price Index.
The US Dollar Index (DXY) refreshes the monthly low at the 101.43 level as market participants welcomed the lack of uncertainty over the Fed’s next move with zeal. Also weighing on the greenback could be the recently downbeat US data. It should be noted that the latest FOMC Minutes and Fedspeak have both confirmed two 50 bps rate hikes, which the market seems to have already priced and hence allows traders to trigger the month-end profit booking moves of the USD.
That said, the US preliminary Q1 2022 Annualized GDP eased to -1.5%, below -1.4% prior and -1.3% forecasts, whereas the Pending Home Sales slumped in April, to -3.9% versus -2.0% forecast.
While the DXY weakness underpins gold’s upside momentum, downbeat data from China and fears of global recession, as well as cautious mood ahead of the key US data test buyers.
China’s Industrial Profits for the January-April period dropped to 3.5% versus 8.5% prior whereas the figures for April slumped to -8.5% versus 12.2% previous gains.
Among the risk-negative negative catalysts are headlines suggesting the US-Taiwan ties, which China dislikes. On the same line are the fears of a global recession. Additionally, Russia’s refrain from stepping back and Ukraine’s readiness to fight more also keeps weighing on the sentiment.
Amid these plays, the US 10-year Treasury yields remained indecisive around 2.75% while the S&P 500 Futures print mild losses around 4,050, down 0.10% intraday at the latest.
Looking forward, the US Dollar Index weakness and mixed catalysts may keep XAU/USD buyers hopeful ahead of the US Core Personal Consumption Expenditure (PCE) Price Index for April, expected at 4.9% YoY versus 5.2% prior. Should the Fed’s preferred inflation gauge rise more than expected, the US dollar may consolidate recent losses and probe the gold buyers.
Technical analysis
Gold portrays the second bounce off the 200-DMA with its latest run-up, suggesting the buyer’s hesitance in leaving the desk. The upside momentum could also gain support from the bullish MACD signals and steady RSI (14).
Hence, the metal prices are likely to extend the latest rebound towards a one-month-old descending resistance line, around $1,868 by the press time.
It’s worth noting that gold’s run-up beyond $1,868 needs validation from the weekly top near $1,870 before directing buyers towards the month’s high close to $1,910.
Alternatively, pullback moves remain elusive beyond the 200-DMA level of $1,839, a break of which will direct the gold sellers towards the $1,808-07 support zone.
In a case where gold bears keep reins past $1,807, the monthly low of around $1,785 will be in focus.
Gold: Daily chart
Trend: Further upside expected
Information on these pages contains forward-looking statements that involve risks and uncertainties. Markets and instruments profiled on this page are for informational purposes only and should not in any way come across as a recommendation to buy or sell in these assets. You should do your own thorough research before making any investment decisions. FXStreet does not in any way guarantee that this information is free from mistakes, errors, or material misstatements. It also does not guarantee that this information is of a timely nature. Investing in Open Markets involves a great deal of risk, including the loss of all or a portion of your investment, as well as emotional distress. All risks, losses and costs associated with investing, including total loss of principal, are your responsibility. The views and opinions expressed in this article are those of the authors and do not necessarily reflect the official policy or position of FXStreet nor its advertisers. The author will not be held responsible for information that is found at the end of links posted on this page.
If not otherwise explicitly mentioned in the body of the article, at the time of writing, the author has no position in any stock mentioned in this article and no business relationship with any company mentioned. The author has not received compensation for writing this article, other than from FXStreet.
FXStreet and the author do not provide personalized recommendations. The author makes no representations as to the accuracy, completeness, or suitability of this information. FXStreet and the author will not be liable for any errors, omissions or any losses, injuries or damages arising from this information and its display or use. Errors and omissions excepted.
The author and FXStreet are not registered investment advisors and nothing in this article is intended to be investment advice.
Recommended content
Editors’ Picks
EUR/USD retreats below 1.0700 after US GDP data

EUR/USD came under modest bearish pressure and retreated below 1.0700. Although the US data showed that the economy grew at a softer pace than expected in Q1, strong inflation-related details provided a boost to the USD.
GBP/USD declines below 1.2500 as USD rebounds

GBP/USD declined below 1.2500 and erased the majority of its daily gains with the immediate reaction to the US GDP report. The US economy expanded at a softer pace than expected in Q1 but the price deflator jumped to 3.4% from 1.8%.
Gold drops below $2,320 as US yields shoot higher

Gold lost its traction and turned negative on the day below $2,320 in the American session on Thursday. The benchmark 10-year US Treasury bond yield is up more than 1% on the day above 4.7% after US GDP report, weighing on XAU/USD.
XRP extends its decline, crypto experts comment on Ripple stablecoin and benefits for XRP Ledger

Ripple extends decline to $0.52 on Thursday, wipes out weekly gains. Crypto expert asks Ripple CTO how the stablecoin will benefit the XRP Ledger and native token XRP.
After the US close, it’s the Tokyo CPI

After the US close, it’s the Tokyo CPI, a reliable indicator of the national number and then the BoJ policy announcement. Tokyo CPI ex food and energy in Japan was a rise to 2.90% in March from 2.50%.