- Gold advances towards $1750 amid the golden cross on the 1H chart.
- Overbought RSI conditions warrant caution, as the critical level gets challenged.
- XAU/USD eyes US data and Biden’s speech, as it extends a three-day winning streak.
Gold (XAU/USD) closes in on the psychological $1750 mark amid a broad-based sell-off in the US dollar, as the Treasury yields resume their corrective declines.
The US stimulus passage and receding inflation fears fail to bode well for the rates, in turn, benefiting the non-yielding gold.
From a short-term technical perspective, gold’s hourly chart confirmed a golden cross that followed a strong move to the upside. A golden cross is represented when the 50-hourly moving average (HMA) crosses the 200-HMA from below.
Although the XAU bulls need to clear the horizontal trendline (orange) resistance at $1741 to unleash additional gains.
The next barrier awaits at the aforesaid $1750 mark, above which the March 1 high at $1760 could be challenged.
The Relative Strength Index (RSI) has eased off highs while trending within the overbought region, suggesting that the price could see a minor pullback before it resumes the recovery momentum.
Gold Price Chart: One-hour
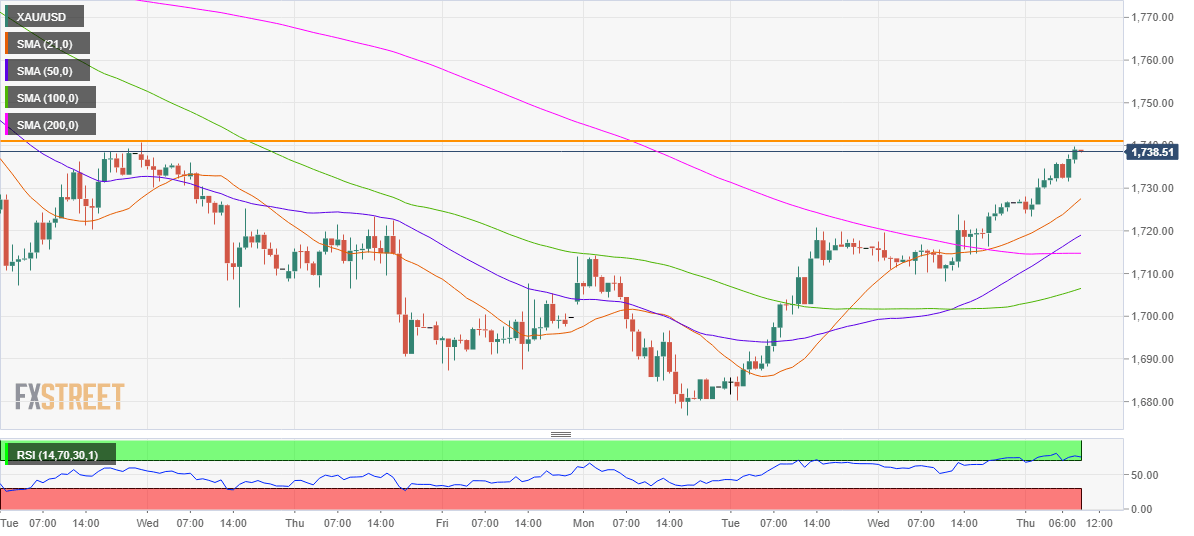
On the flip side, the bullish 21-HMA at $1728 could offer some temporary support to the buyers.
The next downside target for the bears is seen at $1719, the upward-sloping 50-HMA. Further south, the 200-HMA cushion at $1715 could be put to test.
Information on these pages contains forward-looking statements that involve risks and uncertainties. Markets and instruments profiled on this page are for informational purposes only and should not in any way come across as a recommendation to buy or sell in these assets. You should do your own thorough research before making any investment decisions. FXStreet does not in any way guarantee that this information is free from mistakes, errors, or material misstatements. It also does not guarantee that this information is of a timely nature. Investing in Open Markets involves a great deal of risk, including the loss of all or a portion of your investment, as well as emotional distress. All risks, losses and costs associated with investing, including total loss of principal, are your responsibility. The views and opinions expressed in this article are those of the authors and do not necessarily reflect the official policy or position of FXStreet nor its advertisers. The author will not be held responsible for information that is found at the end of links posted on this page.
If not otherwise explicitly mentioned in the body of the article, at the time of writing, the author has no position in any stock mentioned in this article and no business relationship with any company mentioned. The author has not received compensation for writing this article, other than from FXStreet.
FXStreet and the author do not provide personalized recommendations. The author makes no representations as to the accuracy, completeness, or suitability of this information. FXStreet and the author will not be liable for any errors, omissions or any losses, injuries or damages arising from this information and its display or use. Errors and omissions excepted.
The author and FXStreet are not registered investment advisors and nothing in this article is intended to be investment advice.
Recommended content
Editors’ Picks
EUR/USD clings to daily gains above 1.0650

EUR/USD gained traction and turned positive on the day above 1.0650. The improvement seen in risk mood following the earlier flight to safety weighs on the US Dollar ahead of the weekend and helps the pair push higher.
GBP/USD recovers toward 1.2450 after UK Retail Sales data

GBP/USD reversed its direction and advanced to the 1.2450 area after touching a fresh multi-month low below 1.2400 in the Asian session. The positive shift seen in risk mood on easing fears over a deepening Iran-Israel conflict supports the pair.
Gold holds steady at around $2,380 following earlier spike

Gold stabilized near $2,380 after spiking above $2,400 with the immediate reaction to reports of Israel striking Iran. Meanwhile, the pullback seen in the US Treasury bond yields helps XAU/USD hold its ground.
Bitcoin Weekly Forecast: BTC post-halving rally could be partially priced in Premium

Bitcoin price shows no signs of directional bias while it holds above $60,000. The fourth BTC halving is partially priced in, according to Deutsche Bank’s research.
Geopolitics once again take centre stage, as UK Retail Sales wither

Nearly a week to the day when Iran sent drones and missiles into Israel, Israel has retaliated and sent a missile into Iran. The initial reports caused a large uptick in the oil price.