- Gold bulls are alive since the Fed dovish hike.
- $1400 is seen at the line in the sand.
Gold is trading at around 1346 up 1.36% on the day so far as trade wars between the US and China intensify.
Gold weekly chart
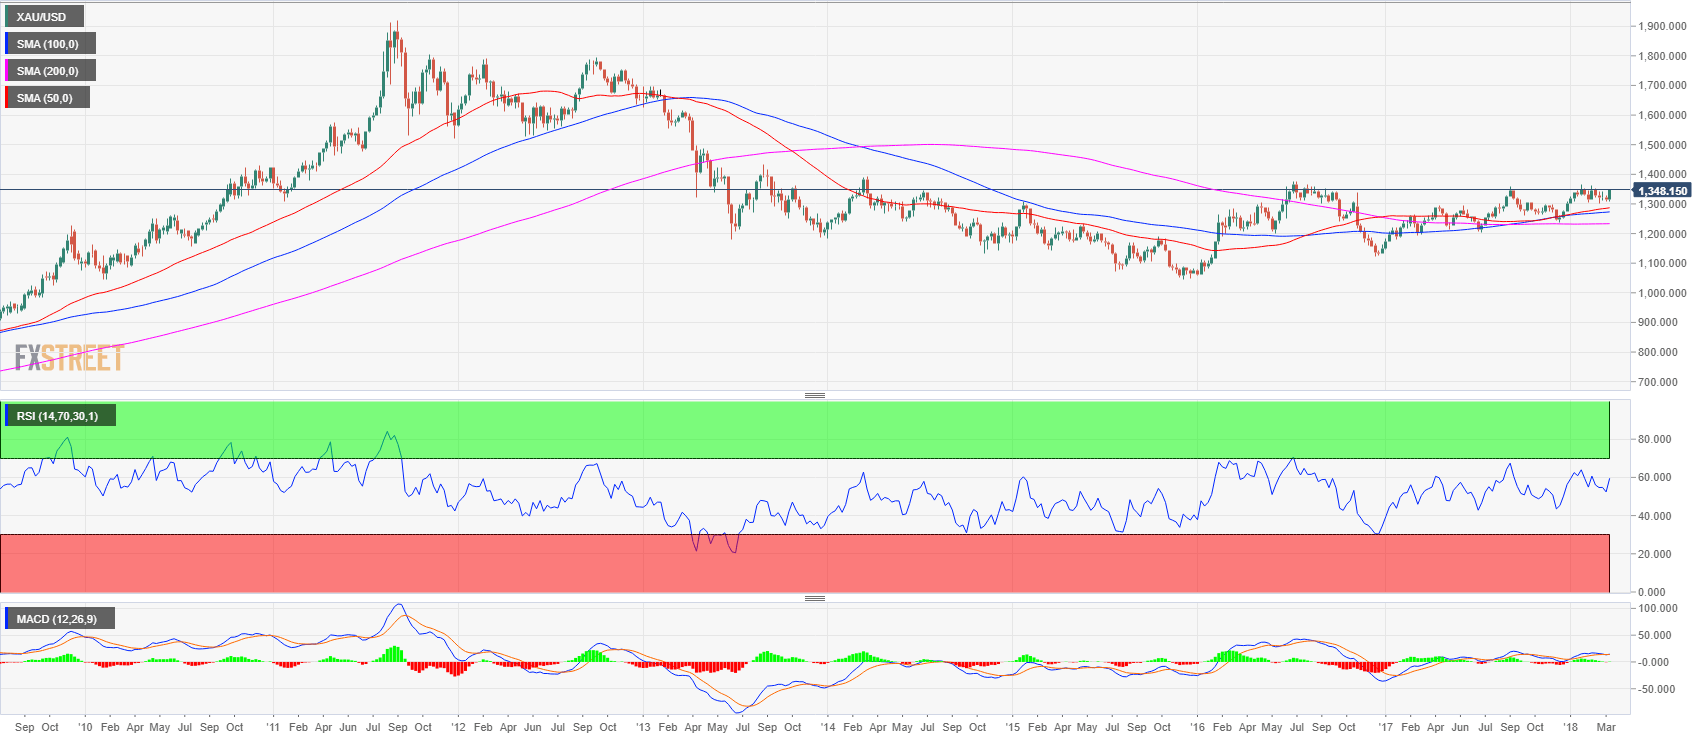
Gold is consolidating and grinding higher in an ascending triangle pattern. Resistance is seen at the high of the year close to the 1365 mark, followed by 1375 the 2016’s high which is only $25 away from the 1400 psychological level. According to many analysts, the 1400 level is the line in the sand that would confirm the bull trend in the yellow metal. Price action is above the 50, 100 and 200-period simple moving average and both the RSI and MACD indicators are trading in positive territories.
Gold daily chart
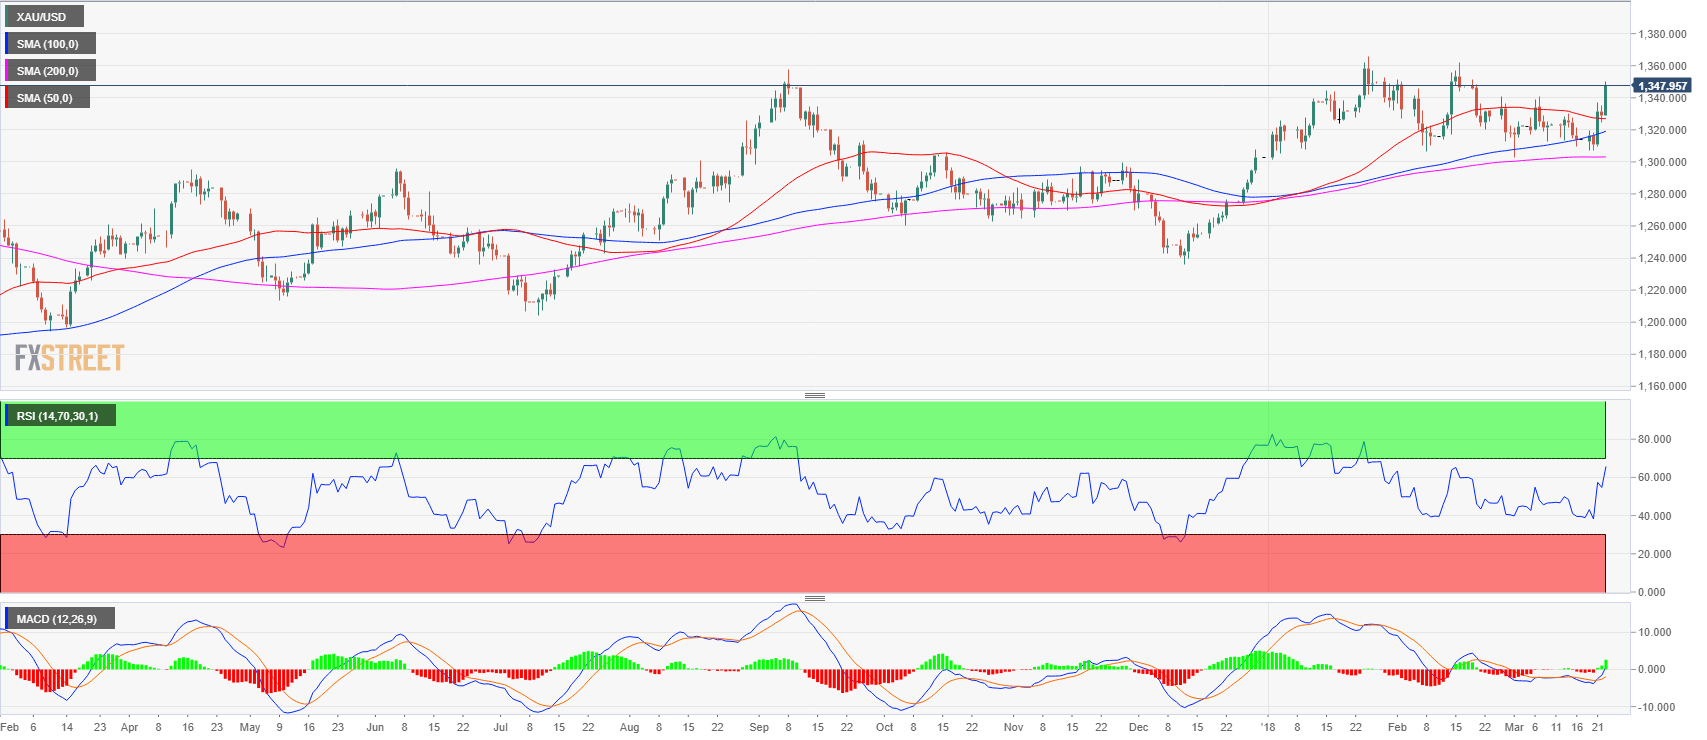
Gold, this Friday tested the 1350 level. After breaking from the bull flag formation on Wednesday on the Fed dovish hike where the US Dollar was sold across the board. Both the MACD and RSI indicators are constructive for bulls. The next key level is seen at approx 1360 high of the year while the 1400 level is the ever-important psychological level discussed in the weekly chart analysis. Support is seen at 1330 previous resistance discussed on Thursday; followed by the low of the range at 1306 which supported the price throughout the first months of 2018.
Gold 4-hour chart
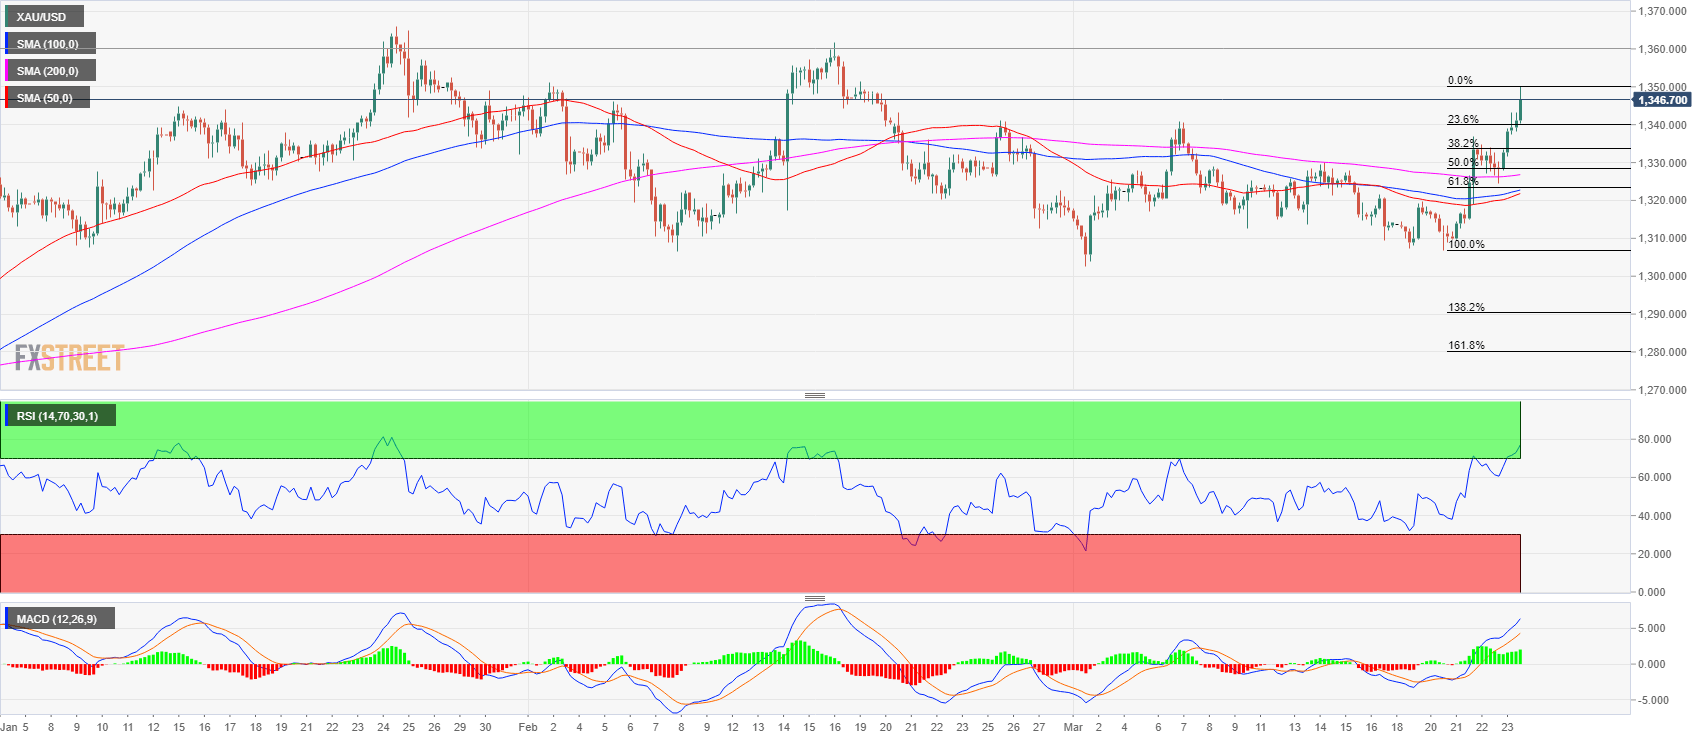
Gold made a two legged-moved ABCD pattern from the lows of the range at 1306 to the 1350 figure. The technical picture suggests that this might be a logical location for a pullback to occur. The RSI and MACD indicator are seen as bullish and no trend reversal seems to be on the cards as bulls have been relentless since Wednesday. Support is initially seen at 1340 which is the 23.6% Fibonacci retracement from the Wednesday-Friday bull leg; followed by 1330 former resistance level which now becomes support. With the army of moving averages just below the level as seen on the 240-minute chart. Resistance is seen in the 1360-1365 area with the high of the year.
Note: All information on this page is subject to change. The use of this website constitutes acceptance of our user agreement. Please read our privacy policy and legal disclaimer. Opinions expressed at FXstreet.com are those of the individual authors and do not necessarily represent the opinion of FXstreet.com or its management. Risk Disclosure: Trading foreign exchange on margin carries a high level of risk, and may not be suitable for all investors. The high degree of leverage can work against you as well as for you. Before deciding to invest in foreign exchange you should carefully consider your investment objectives, level of experience, and risk appetite. The possibility exists that you could sustain a loss of some or all of your initial investment and therefore you should not invest money that you cannot afford to lose. You should be aware of all the risks associated with foreign exchange trading, and seek advice from an independent financial advisor if you have any doubts.
Recommended content
Editors’ Picks
AUD/USD posts gain, yet dive below 0.6500 amid Aussie CPI, ahead of US GDP

The Aussie Dollar finished Wednesday’s session with decent gains of 0.15% against the US Dollar, yet it retreated from weekly highs of 0.6529, which it hit after a hotter-than-expected inflation report. As the Asian session begins, the AUD/USD trades around 0.6495.
USD/JPY finds its highest bids since 1990, approaches 156.00

USD/JPY broke into its highest chart territory since June of 1990 on Wednesday, peaking near 155.40 for the first time in 34 years as the Japanese Yen continues to tumble across the broad FX market.
Gold stays firm amid higher US yields as traders await US GDP data

Gold recovers from recent losses, buoyed by market interest despite a stronger US Dollar and higher US Treasury yields. De-escalation of Middle East tensions contributed to increased market stability, denting the appetite for Gold buying.
Ethereum suffers slight pullback, Hong Kong spot ETH ETFs to begin trading on April 30

Ethereum suffered a brief decline on Wednesday afternoon despite increased accumulation from whales. This follows Ethereum restaking protocol Renzo restaked ETH crashing from its 1:1 peg with ETH and increased activities surrounding spot Ethereum ETFs.
Dow Jones Industrial Average hesitates on Wednesday as markets wait for key US data

The DJIA stumbled on Wednesday, falling from recent highs near 38,550.00 as investors ease off of Tuesday’s risk appetite. The index recovered as US data continues to vex financial markets that remain overwhelmingly focused on rate cuts from the US Fed.