- GBP/USD once again stalled the intraday positive move near ascending channel resistance.
- The set-up favours bullish traders and supports prospects for the emergence of dip-buying.
- A sustained break below the 1.3200 mark is needed to negate the near-term bullish outlook.
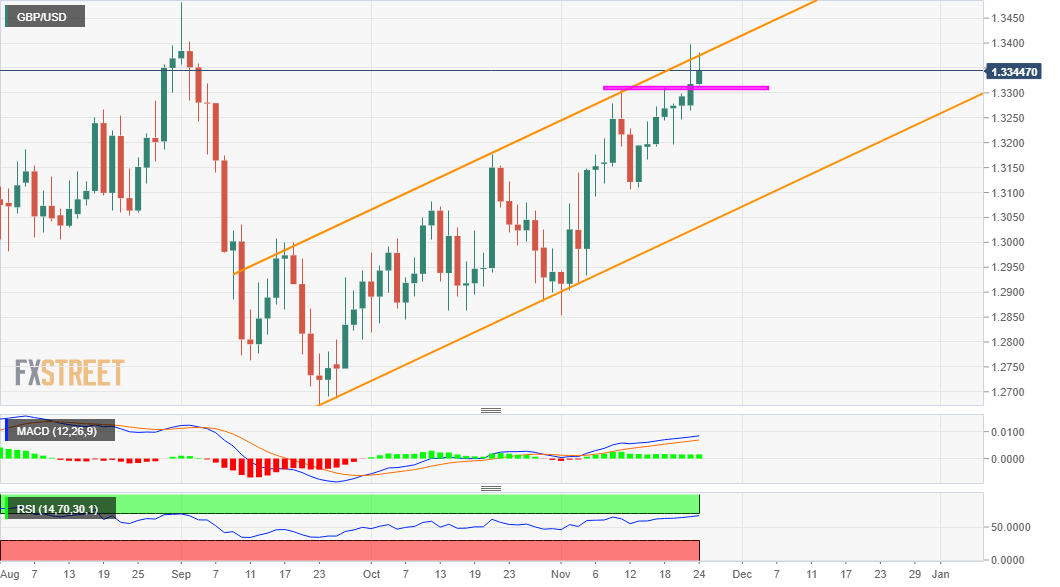
The GBP/USD pair trimmed a part of its intraday gains to the 1.3380 region and once again witnessed a modest pullback from the top end of a two-month-old ascending trend-channel. The pair's inability to break through the channel resistance warrants some caution for bullish traders.
However, the fact that the GBP/USD pair has managed to hold above the 1.3310-1.3300 resistance breakpoint, the near-term bias seems tilted in favour of bullish traders. Hence, a pullback towards the mentioned resistance-turned-support might still be seen as a buying opportunity.
Meanwhile, technical indicators on the daily chart maintained their bullish bias and further support prospects for the emergence of some dip-buying at lower levels. That said, some follow-through weakness below the 1.3300 mark might prompt some technical selling.
The GBP/USD pair might then accelerate the retracement slide towards the 1.3265-60 horizontal support before eventually dropping to test the 1.3200 round-figure mark. Failure to defend the mentioned support levels will negate the near-term constructive outlook.
On the flip side, bulls might now wait for a sustained strength beyond the 1.3400 mark to confirm a trend-channel breakout. The momentum could then push the GBP/USD pair back towards September monthly swing highs, around the 1.3480 region, en-route the key 1.3500 psychological mark.
GBP/USD daily chart
Technical levels to watch
Information on these pages contains forward-looking statements that involve risks and uncertainties. Markets and instruments profiled on this page are for informational purposes only and should not in any way come across as a recommendation to buy or sell in these assets. You should do your own thorough research before making any investment decisions. FXStreet does not in any way guarantee that this information is free from mistakes, errors, or material misstatements. It also does not guarantee that this information is of a timely nature. Investing in Open Markets involves a great deal of risk, including the loss of all or a portion of your investment, as well as emotional distress. All risks, losses and costs associated with investing, including total loss of principal, are your responsibility. The views and opinions expressed in this article are those of the authors and do not necessarily reflect the official policy or position of FXStreet nor its advertisers. The author will not be held responsible for information that is found at the end of links posted on this page.
If not otherwise explicitly mentioned in the body of the article, at the time of writing, the author has no position in any stock mentioned in this article and no business relationship with any company mentioned. The author has not received compensation for writing this article, other than from FXStreet.
FXStreet and the author do not provide personalized recommendations. The author makes no representations as to the accuracy, completeness, or suitability of this information. FXStreet and the author will not be liable for any errors, omissions or any losses, injuries or damages arising from this information and its display or use. Errors and omissions excepted.
The author and FXStreet are not registered investment advisors and nothing in this article is intended to be investment advice.
Recommended content
Editors’ Picks
AUD/USD jumps above 0.6500 after hot Australian CPI data

AUD/USD extended gains and recaptured 0.6500 in Asian trading, following the release of hotter-than-expected Australian inflation data. The Australian CPI rose 1% in QoQ in Q1 against 0.8% forecast, providing extra legs to the Australian Dollar upside.
USD/JPY hangs near 34-year high at 154.88 as intervention risks loom

USD/JPY is sitting at a multi-decade high of 154.88 reached on Tuesday. Traders refrain from placing fresh bets on the pair as Japan's FX intervention risks loom. Broad US Dollar weakness also caps the upside in the major. US Durable Goods data are next on tap.
Gold price cautious despite weaker US Dollar and falling US yields

Gold retreats modestly after failing to sustain gains despite fall in US Treasury yields, weaker US Dollar. XAU/USD struggles to capitalize following release of weaker-than-expected S&P Global PMIs, fueling speculation about potential Fed rate cuts.
Crypto community reacts as BRICS considers launching stablecoin for international trade settlement

BRICS is intensifying efforts to reduce its reliance on the US dollar after plans for its stablecoin effort surfaced online on Tuesday. Most people expect the stablecoin to be backed by gold, considering BRICS nations have been accumulating large holdings of the commodity.
US versus the Eurozone: Inflation divergence causes monetary desynchronization

Historically there is a very close correlation between changes in US Treasury yields and German Bund yields. This is relevant at the current juncture, considering that the recent hawkish twist in the tone of the Fed might continue to push US long-term interest rates higher and put upward pressure on bond yields in the Eurozone.