- GBP/USD caught some aggressive bids on Monday and surged past the 1.3000 psychological mark.
- The technical set-up favours bullish traders, though warrant some caution before placing fresh bets.
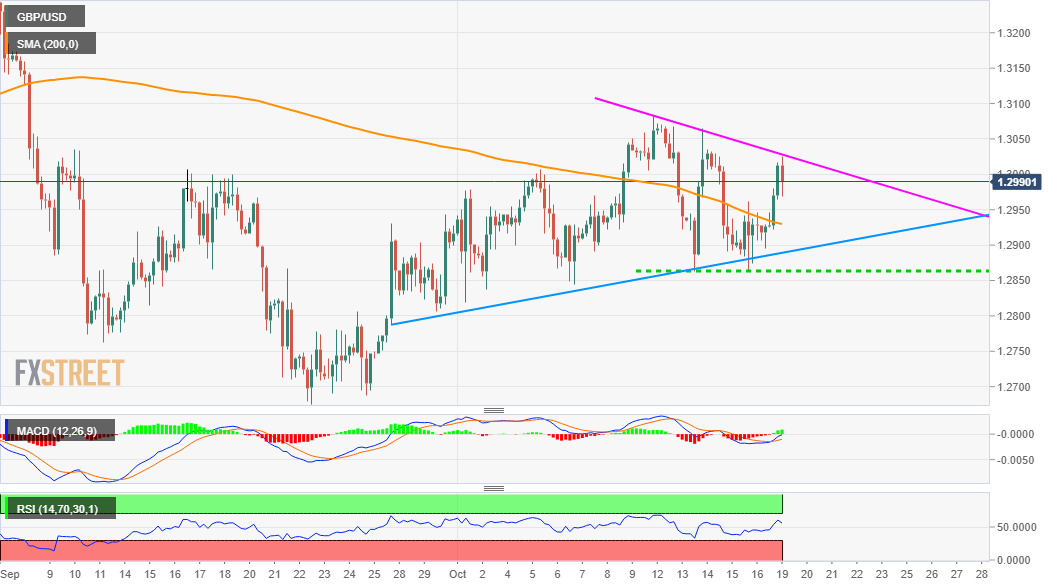
- Sustained move beyond a one-week-old descending trend-line needed to confirm any further gains.
The GBP/USD pair added to its strong intraday gains and refreshed daily tops, around the 1.3025 region during the early North American session.
Given that the pair last week attracted some dip-buying near the 1.2865-60 horizontal zone, a sustained move beyond the 200-period SMA on the 4-hourly chart was seen a key trigger for bullish traders. The strong intraday positive momentum was further supported by bullish oscillators on hourly charts.
Meanwhile, technical indicators on the daily chart have just started moving into the positive territory, albeit are yet to gain any meaningful traction. Hence, it will be prudent to wait for some follow-through buying beyond a one-week-old descending trend-line resistance before positioning for any further appreciating move.
The mentioned hurdle is pegged near the 1.3025-30 region, above which bulls are likely to aim back towards monthly swing highs, around the 1.3080 supply zone. The momentum could then push the GBP/USD pair further beyond the 1.3100 mark, towards testing the next major hurdle near the 1.3160 horizontal zone.
On the flip side, the 1.2940 region (200-period SMA) now seems to protect the immediate downside. failure to defend the mentioned support might prompt some technical selling and turn the pair vulnerable to slide back to test sub-1.2900 level. That said any subsequent fall might still find decent support near the 1.2865-60 region.
GBP/USD 4-hourly chart
Technical levels to watch
Information on these pages contains forward-looking statements that involve risks and uncertainties. Markets and instruments profiled on this page are for informational purposes only and should not in any way come across as a recommendation to buy or sell in these assets. You should do your own thorough research before making any investment decisions. FXStreet does not in any way guarantee that this information is free from mistakes, errors, or material misstatements. It also does not guarantee that this information is of a timely nature. Investing in Open Markets involves a great deal of risk, including the loss of all or a portion of your investment, as well as emotional distress. All risks, losses and costs associated with investing, including total loss of principal, are your responsibility. The views and opinions expressed in this article are those of the authors and do not necessarily reflect the official policy or position of FXStreet nor its advertisers. The author will not be held responsible for information that is found at the end of links posted on this page.
If not otherwise explicitly mentioned in the body of the article, at the time of writing, the author has no position in any stock mentioned in this article and no business relationship with any company mentioned. The author has not received compensation for writing this article, other than from FXStreet.
FXStreet and the author do not provide personalized recommendations. The author makes no representations as to the accuracy, completeness, or suitability of this information. FXStreet and the author will not be liable for any errors, omissions or any losses, injuries or damages arising from this information and its display or use. Errors and omissions excepted.
The author and FXStreet are not registered investment advisors and nothing in this article is intended to be investment advice.
Recommended content
Editors’ Picks
AUD/USD remained bid above 0.6500

AUD/USD extended further its bullish performance, advancing for the fourth session in a row on Thursday, although a sustainable breakout of the key 200-day SMA at 0.6526 still remain elusive.
EUR/USD faces a minor resistance near at 1.0750

EUR/USD quickly left behind Wednesday’s small downtick and resumed its uptrend north of 1.0700 the figure, always on the back of the persistent sell-off in the US Dollar ahead of key PCE data on Friday.
Gold holds around $2,330 after dismal US data

Gold fell below $2,320 in the early American session as US yields shot higher after the data showed a significant increase in the US GDP price deflator in Q1. With safe-haven flows dominating the markets, however, XAU/USD reversed its direction and rose above $2,340.
Bitcoin price continues to get rejected from $65K resistance as SEC delays decision on spot BTC ETF options

Bitcoin (BTC) price has markets in disarray, provoking a broader market crash as it slumped to the $62,000 range on Thursday. Meanwhile, reverberations from spot BTC exchange-traded funds (ETFs) continue to influence the market.
US economy: slower growth with stronger inflation

The dollar strengthened, and stocks fell after statistical data from the US. The focus was on the preliminary estimate of GDP for the first quarter. Annualised quarterly growth came in at just 1.6%, down from the 2.5% and 3.4% previously forecast.