- GBP/USD wobbles near late February tops after the heaviest run-up in three weeks.
- Immediate hurdle, RSI conditions suggest pullback towards previous key resistance.
- Multiple confluences will offer a bumpy ride to the bears, bulls aim for yearly top.
GBP/USD bulls catch a breather around 1.4125, up 0.05% intraday, amid Tuesday’s Asian session. The cable jumped to the highest in 10 weeks the previous day, not to forget posting the biggest daily gain since April 19.
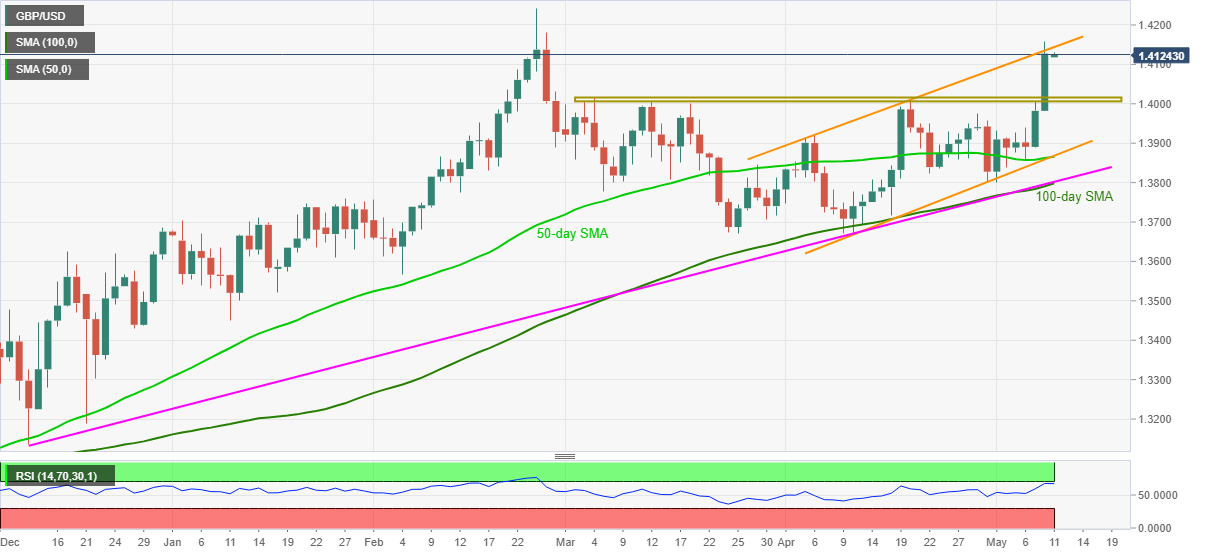
However, the heavy run-up propelled the RSI line close to the overbought region as the prices test the upper line of the one-month-old rising trend channel. Though, the quote remains well beyond the 1.4010-20 previous resistance area, crossed on Monday.
Hence, GBP/USD may witness short-term pullback towards revisiting the 1.4020-10 area but any further downside becomes doubtful.
If at all the bears dominate below 1.4010, they need to conquer the 1.4000 psychological magnet before challenging the 1.3865-60 support confluence including 50-day SMA and lower line of the stated channel. It’s worth mentioning that 100-day SMA and a rising trend line from December 11, 2020, add to the downside filter around the 1.3800 threshold.
Meanwhile, a clear upside past-1.4145 becomes necessary for the GBP/USD bulls to challenge the yearly top surrounding 1.4245. During the rally, the 1.4200 round figure could act as an intermediate halt.
GBP/USD daily chart
Trend: Pullback expected
Information on these pages contains forward-looking statements that involve risks and uncertainties. Markets and instruments profiled on this page are for informational purposes only and should not in any way come across as a recommendation to buy or sell in these assets. You should do your own thorough research before making any investment decisions. FXStreet does not in any way guarantee that this information is free from mistakes, errors, or material misstatements. It also does not guarantee that this information is of a timely nature. Investing in Open Markets involves a great deal of risk, including the loss of all or a portion of your investment, as well as emotional distress. All risks, losses and costs associated with investing, including total loss of principal, are your responsibility. The views and opinions expressed in this article are those of the authors and do not necessarily reflect the official policy or position of FXStreet nor its advertisers. The author will not be held responsible for information that is found at the end of links posted on this page.
If not otherwise explicitly mentioned in the body of the article, at the time of writing, the author has no position in any stock mentioned in this article and no business relationship with any company mentioned. The author has not received compensation for writing this article, other than from FXStreet.
FXStreet and the author do not provide personalized recommendations. The author makes no representations as to the accuracy, completeness, or suitability of this information. FXStreet and the author will not be liable for any errors, omissions or any losses, injuries or damages arising from this information and its display or use. Errors and omissions excepted.
The author and FXStreet are not registered investment advisors and nothing in this article is intended to be investment advice.
Recommended content
Editors’ Picks
AUD/USD failed just ahead of the 200-day SMA

Finally, AUD/USD managed to break above the 0.6500 barrier on Wednesday, extending the weekly recovery, although its advance faltered just ahead of the 0.6530 region, where the key 200-day SMA sits.
EUR/USD met some decent resistance above 1.0700

EUR/USD remained unable to gather extra upside traction and surpass the 1.0700 hurdle in a convincing fashion on Wednesday, instead giving away part of the weekly gains against the backdrop of a decent bounce in the Dollar.
Gold stays firm amid higher US yields as traders await US GDP data

Gold recovers from recent losses, buoyed by market interest despite a stronger US Dollar and higher US Treasury yields. De-escalation of Middle East tensions contributed to increased market stability, denting the appetite for Gold buying.
Ethereum suffers slight pullback, Hong Kong spot ETH ETFs to begin trading on April 30

Ethereum suffered a brief decline on Wednesday afternoon despite increased accumulation from whales. This follows Ethereum restaking protocol Renzo restaked ETH crashing from its 1:1 peg with ETH and increased activities surrounding spot Ethereum ETFs.
Dow Jones Industrial Average hesitates on Wednesday as markets wait for key US data

The DJIA stumbled on Wednesday, falling from recent highs near 38,550.00 as investors ease off of Tuesday’s risk appetite. The index recovered as US data continues to vex financial markets that remain overwhelmingly focused on rate cuts from the US Fed.